Historical News
Fixed Site Network
Phillipsdale Landing
Water quality was good this week at Phillipsdale Landing. Approximately 0.43 inches of precipitation was recorded over the week, with most of the rain occurring between November 18 and November 20. In response to the rainfall and increase in freshwater river flow, surface salinity decreased slightly mid-week. Surface salinity averaged 14.4 ppt and ranged from 5.9 ppt to 22.8 ppt. A portion of this week's bottom salinity data, approximately three hours in the afternoon on November 20, were deemed suspect by NBC scientists. The salinity data appeared anomalously low, indicating that perhaps the sensor was obstructed by debris. The remaining bottom salinity averaged 25.6 ppt and ranged from 12.5 ppt to 29.4 ppt. Compared to last week, water temperatures at both the surface and bottom cooled this week, with surface temperatures averaging 7.1°C and bottom temperatures averaging 9.2°C. Dissolved oxygen (DO) concentrations this week were good, remaining above the hypoxia threshold (2.9 mg/L) at both depths. Surface DO averaged 10.1 mg/L with a minimum of 8.5 mg/L and bottom DO averaged 8.1 mg/L with a minimum of 7.0 mg/L. Surface chlorophyll-a remained low all week, averaging 2.2 ug/L with a maximum of 8.4 ug/L. Note that tidal fluctuations and Blackstone River flow greatly influence water column DO, temperature, and salinity at this location.
Bullock Reach
Due to remote data transfer issues, there are no current Bullock Reach data available for this week. The data are being internally logged by the sondes, and will be updated to the blog as they become available.
Please note, the Bullock Reach sondes were removed for the 2019 season on November 19.
R/V Monitor's Blog
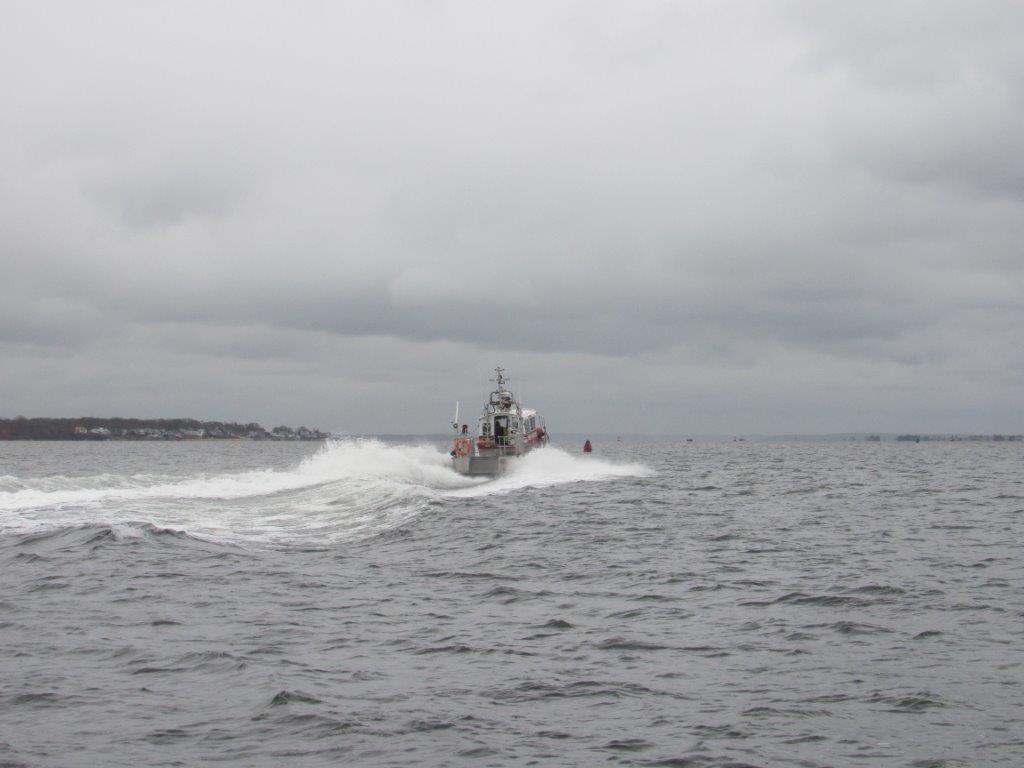
On Wednesday, November 20th, the crew of the R/V Monitor was out on the upper Bay collecting nutrients and plankton samples, taking Secchi Disk water clarity measurements, and conducting real-time surface mapping of water quality parameters, including dissolved oxygen, chlorophyll, water temperature, salinity, and pH, all in an effort to document water quality improvements associated with NBC construction projects. Jeff captained the boat while monitoring professionals Sara and Fern collected the samples and data. It was a cloudy, raw and wet day with a moderate wind blowing out of the north-northwest, making the water choppy. Today's photo features a rescue boat observed underway.
Surface Mapping
Data were collected on November 20, 2019 while the R/V Monitor was underway collecting nutrient samples in the Providence River estuary. The chlorophyll concentrations were good. From north to south, average chlorophyll concentrations were as follows: Upper Providence River (1.47 µg/L), Edgewood Shoals area (1.66 µg/L), Pawtuxet River area (1.58 µg/L), and Lower Providence River area (1.80 µg/L). Overall, chlorophyll ranged between non-detectable and 4.70 µg/L with an overall average of 1.67 µg/L. The chlorophyll data from this date are presented in the map below: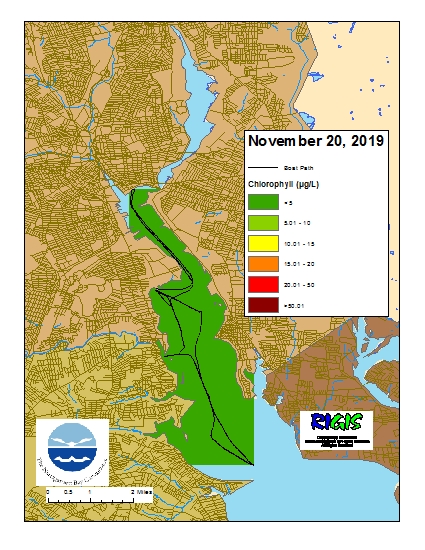
Bacteria Sampling
Water Column Clarity
Water clarity was measured at six locations in the Providence River on November 20, 2019. Approximately 0.25 inches of rainfall occurred over the two days prior to the survey, and light rain continued to fall on the survey day itself. The average Secchi depth decreased since the last survey on November 6, from 2.9 m to 2.4 m. Almost all sites exhibited decreased clarity since the previous survey, with the greatest decrease (down 1.0 m) observed at Edgewood Yacht Club. Only one site exhibited increased clarity, India Point Park, up 0.8 m. Water clarity ranged from 1.7 m at Pawtuxet Cove to 2.7 m at India Point Park, Bullock Reach, and Conimicut Point. There was no evidence for a clarity gradient from north to south this week.
