Historical News
R/V Monitor's Blog
The NBC was out on the Bay twice this week. First, on Tuesday, October 6th, the crew was out servicing the Bullock's Reach buoy. The sondes were swapped out with freshly calibrated sondes. Sara captained the boat while monitoring professionals Mike and Daryll serviced the buoy. It was a beautiful sunny day with no wind and calm waters. On Wednesday, October 7th, a crew was collecting nutrients samples, taking Secchi Disk and Par sensor water clarity measurements, conducting water column profiles using the Seabird instrument, and conducting real-time surface mapping of water quality parameters, including dissolved oxygen, chlorophyll, water temperature, salinity, and pH, all in an effort to document water quality improvements associated with NBC construction projects. Sara captained the boat again while monitoring professionals Jeff and Daryll collected the samples and data. It was a partly cloudy day with a moderate wind out of the southwest and a chop on the water. A photo of a cargo ship at ProvPort was taken this day.

Bacteria Sampling
Twenty stations were sampled for fecal coliform in the Providence and Seekonk Rivers on October 1, 2020. Five of these stations were also sampled for enterococci bacteria. On the day prior to sampling, 0.54 inches of precipitation occurred, while rainfall totaled 0.63 inches within the five days prior to sampling.
The geometric mean of fecal coliform results for all sites was 225 MPN/100 mL; bacteria counts were higher in the Seekonk River than the Providence River (geometric means of 847 MPN/100 mL and 121 MPN/100 mL, respectively). The maximum count (46,000 MPN/100 mL) was measured at the Point St. Bridge site in the Providence River. Fecal coliform results from the Providence and Seekonk Rivers exceeded state primary contact and shellfishing standards.
Enterococci results increased from the previous sampling event, from an overall geomean of 18 MPN/100 mL to 26 MPN/100 mL. Enterococci results ranged from <10 MPN/100 mL at Conimicut Point to 1,178 MPN/100 mL at Point St. Bridge. Enterococci results exceeded state primary contact standards.
Please note: the results of NBC's fecal coliform and enterococci monitoring are for informational/research purposes only and are not to intended to suggest official state compliance with bathing or shellfishing standards.
Water Column Clarity
Water clarity was measured at eight locations in the Providence and Seekonk Rivers on October 1, 2020. In the five days prior to sampling, 0.63 inches of rainfall was recorded, with 0.54 inches occurring the day prior to the water clarity survey. Water clarity decreased by 0.08 m compared to the previous survey. Overall, Secchi depth averaged 1.80 m. Lowest water clarity was recorded at Phillipsdale Landing (0.63 m), while greatest water clarity was measured at Conimicut Point (3.23 m). Overall, water clarity generally increased along a north to south gradient.
Fixed Site Network
Water quality was good this week at Phillipsdale Landing. Sondes were changed out for routine maintenance on September 29. Over the course of the week, 0.63 inches of rainfall was recorded, with the majority of this rainfall (0.54 in) occurring on September 30. Decreases in both surface and bottom salinity occurred following this mid-week rain event, driven by increased Blackstone River flows. Salinity averaged 21.2 ppt in surface waters and ranged from 12.2 ppt to 26.6 ppt. Bottom salinity averaged 25.2 ppt and ranged from 14.9 ppt to 28.9 ppt. Surface and bottom water temperatures averaged 20.9°C and 20.6°C, respectively. Surface temperatures ranged from 17.9°C to 22.2°C, while bottom temperatures ranged from 19.6°C to 22.1°C.
Dissolved oxygen (DO) remained above the hypoxia threshold (2.9 mg/L) in surface and bottom waters this week. Surface DO averaged 9.7 mg/L, with a minimum of 6.1 mg/L, and bottom DO averaged 6.7 mg/L, with a minimum of 3.1 mg/L. Chlorophyll concentrations were greater than concentrations measured last week. Surface chlorophyll averaged 69.6 ug/L and bottom chlorophyll averaged 41.3 ug/L; maximum chlorophyll concentrations were over 100 ug/L at both depths. Please note that tidal fluctuations and Blackstone River flow greatly influence water column salinity, temperature, and dissolved oxygen at this location.
Bullock Reach
Water quality was good this week at Bullock Reach. Over the course of the week, salinity decreased and water temperatures increased. Surface salinity averaged 29.5 ppt and ranged from 27.3 ppt to 30.5 ppt. Salinity at the mid depth averaged 30.3 ppt and ranged from 28.5 ppt to 30.9 ppt, while salinity in bottom waters averaged 30.1 ppt and ranged from 27.9 ppt to 31.6 ppt. Temperatures averaged 19.9°C, 19.7°C, and 19.3°C at the surface, middle, and bottom of the water column, respectively. Surface temperatures ranged from 18.6°C to 20.8°C, mid temperatures ranged from 18.5°C to 20.4°C, and bottom temperatures ranged from 17.7°C to 20.1°C.
Dissolved oxygen (DO) concentrations remained above the hypoxia threshold (2.9 mg/L) throughout the water column. Surface DO averaged 7.4 mg/L, while mid DO averaged 6.8 mg/L. Bottom DO averaged 6.2 mg/L, with a minimum of 5.4 mg/L. Chlorophyll concentrations generally increased over the course of the week. Surface chlorophyll averaged 8.4 ug/L, mid chlorophyll averaged 6.7 ug/L, and bottom chlorophyll averaged 3.7 ug/L. The maximum water column chlorophyll concentration was 27.7 ug/L, measured in surface waters on September 29.
Surface Mapping
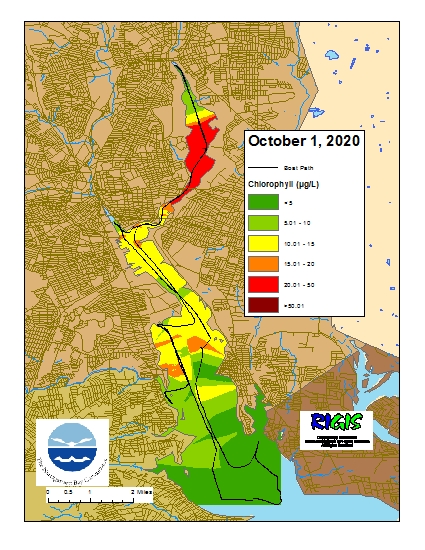
Data
were collected on October 1, 2020 while the R/V Monitor was underway collecting
bacteria samples and performing vertical profiles in the Providence and Seekonk
River estuaries. The chlorophyll concentrations were poor to good in the areas
surveyed with a north-south gradient. From north to south, average chlorophyll
concentrations were as follows: Seekonk River (24.80 µg/L), Upper Providence
River (12.16 µg/L), Edgewood Shoals area (12.96 µg/L), Pawtuxet River area (7.30
µg/L), and Lower Providence River area (3.34 µg/L). Overall, chlorophyll ranged
between 0.60 µg/L and 57.60 µg/L with an overall average of 11.95 µg/L.
The chlorophyll data from this date are presented in the map below: