Historical News
Surface Mapping
Data were collected on November 20, 2019 while the R/V Monitor was underway collecting nutrient samples in the Providence River estuary. The chlorophyll concentrations were good. From north to south, average chlorophyll concentrations were as follows: Upper Providence River (1.47 µg/L), Edgewood Shoals area (1.66 µg/L), Pawtuxet River area (1.58 µg/L), and Lower Providence River area (1.80 µg/L). Overall, chlorophyll ranged between non-detectable and 4.70 µg/L with an overall average of 1.67 µg/L. The chlorophyll data from this date are presented in the map below: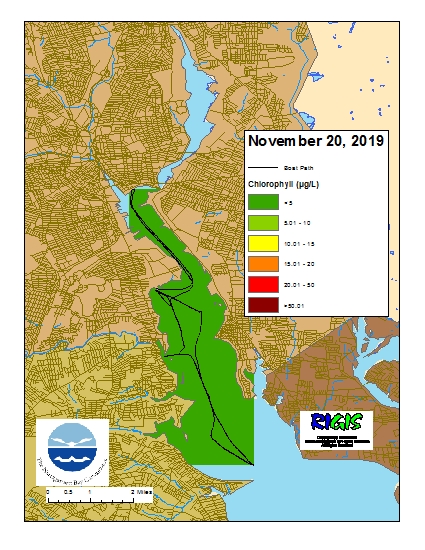
Bacteria Sampling
Water Column Clarity
Water clarity was measured at six locations in the Providence River on November 20, 2019. Approximately 0.25 inches of rainfall occurred over the two days prior to the survey, and light rain continued to fall on the survey day itself. The average Secchi depth decreased since the last survey on November 6, from 2.9 m to 2.4 m. Almost all sites exhibited decreased clarity since the previous survey, with the greatest decrease (down 1.0 m) observed at Edgewood Yacht Club. Only one site exhibited increased clarity, India Point Park, up 0.8 m. Water clarity ranged from 1.7 m at Pawtuxet Cove to 2.7 m at India Point Park, Bullock Reach, and Conimicut Point. There was no evidence for a clarity gradient from north to south this week.
Water Column Clarity
Water clarity was measured at eight locations in the Providence and Seekonk Rivers on November 6, 2019. Approximately 0.49 inches of rainfall occurred the day prior to the survey. The average Secchi depth decreased since the last survey on October 24, from 3.3 m to 2.9 m. Three sites exhibited decreased clarity since the previous survey, with the greatest decrease (down 1.3 m) observed at Conimicut Point. Two sites exhibited increased clarity, the greatest of which was seen at Pomham Rocks (up 0.4 m). The remaining sites exhibited unchanged clarity or had not been surveyed recently. Water clarity ranged from 1.5 m at Phillipsdale Landing to 3.9 m at Edgewood Shoal. While the Seekonk River sites exhibited the lowest clarity this week, the overall north to south gradient in increasing clarity was weak, with variable clarity throughout the Providence River.
Fixed Site Network
Phillipsdale Landing
Water quality was good this week at Phillipsdale Landing. The sondes were changed out for routine maintenance mid-day on November 13. A portion of the data, approximately 2.5 hours late night November 11 into early morning November 12, was affected by a buoyancy issue and has been excluded from the summary written below. Approximately 0.8 inches of precipitation was recorded on November 12, but salinity did not appear to be impacted greatly. Surface salinity averaged 12.7 ppt and ranged from 2.5 ppt to 22.5 ppt while bottom salinity averaged 22.9 ppt and ranged from 8.1 ppt to 28.5 ppt. Compared to last week, water temperatures at both the surface and bottom cooled this week, with surface temperatures averaging 8.5°C and bottom temperatures averaging 11.2°C. Dissolved oxygen (DO) concentrations this week were good, remaining above the hypoxia threshold (2.9 mg/L) at both depths. Surface DO averaged 9.6 mg/L with a minimum of 7.6 mg/L and bottom DO averaged 7.5 mg/L with a minimum of 6.0 mg/L. Surface chlorophyll-a remained low all week, averaging 2.4 ug/L with a maximum of 5.7 ug/L. Note that tidal fluctuations and Blackstone River flow greatly influence water column DO, temperature, and salinity at this location.
Bullock Reach
Due to remote data transfer issues, there are no current Bullock Reach data available for this week. The data are being internally logged by the sondes, and will be updated to the blog as they become available.

