Historical News
Fixed Site Network
Nutrients Sampling
Nutrient samples were collected at five local river stations and seven bay stations (surface and bottom) on September 25, 2019. Moderate rainfall of just under 0.3 inches was recorded the day prior to sampling.
Among the river stations sampled, the highest total nitrogen (TN) and the highest dissolved inorganic nitrogen (DIN) values occurred in the sample from the Pawtuxet River at Broad St. site, at 1,500 ppb and 1,127 ppb, respectively. During the time of sampling at this site, there were low water levels and plant particulates observed, which likely contributed to the elevated TN and DIN results. The highest total dissolved nitrogen (TDN) results occurred at both the Pawtuxet River at Broad St. and Blackstone River at Main St. sites, with concentrations of 1,340 ppb; this temporary Blackstone River site is just south of the routine site at Slater Mill, which was inaccessible due to dam repair work at the time of this survey. The lowest TN value (707 ppb) and the lowest TDN value (509 ppb), occurred at the Moshassuck River at Higginson Ave. site, while the lowest DIN concentration (158 ppb) occurred at the Ten Mile River at Roger Williams Ave. site.
At the bay surface stations, the greatest TN results occurred at Phillipsdale Landing, at 1,425 ppb (average of duplicates). TDN and DIN were highest at Pawtuxet Cove, at 666 ppb and 557.5 ppb, respectively. The lowest TN value (724 ppb) occurred at Conimicut Point, while the lowest DIN value (<13 ppb) occurred at Edgewood Yacht Club. Three bay stations had TDN values below detection (<100 ppb) - Conimicut Point, Edgewood Yacht Club, and Bullock Reach. Chlorophyll a concentrations averaged 15.7 ug/L and ranged from 9.6 ug/L at Pomham Rocks to 22.4 ug/L at Phillipsdale Landing (average of duplicates).
Results from nutrients sampling on October 9, October 23, and October 24 are pending laboratory analysis; the next scheduled sample date is November 6.
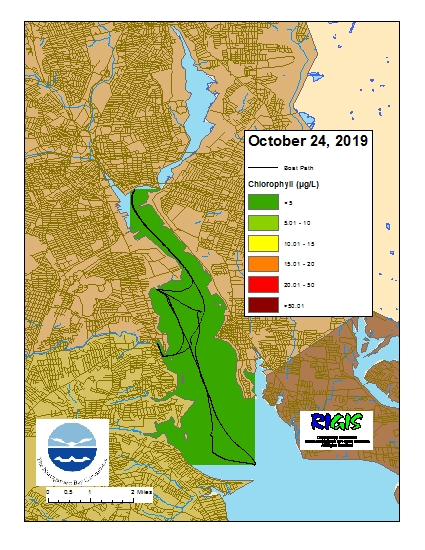
Surface Mapping
Data were collected on October 24, 2019 while the R/V Monitor was underway collecting nutrient samples in the Providence River estuary. The chlorophyll concentrations were good. From north to south, average chlorophyll concentrations were as follows: Upper Providence River (1.48 µg/L), Edgewood Shoals area (1.50 µg/L), Pawtuxet River area (1.74 µg/L), and Lower Providence River area (1.54 µg/L). Overall, chlorophyll ranged between undetectable and 3.90 µg/L with an overall average of 1.56 µg/L. The chlorophyll data from this date are presented in the map below:
R/V Monitor's Blog
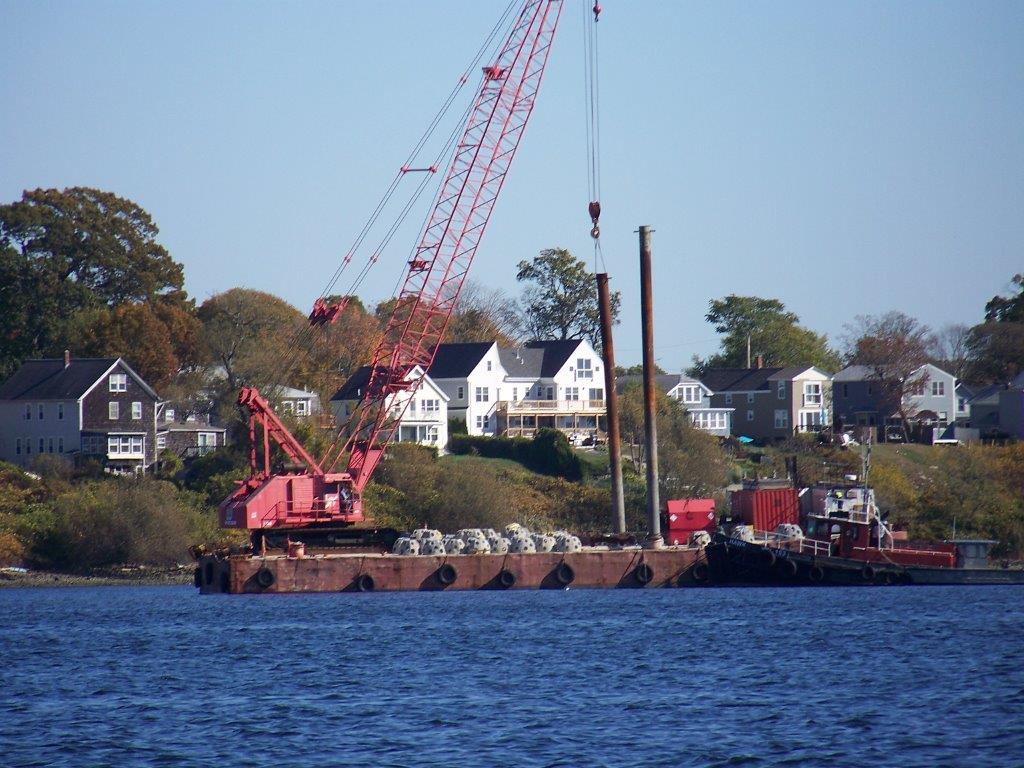
The crew of the R/V Monitor was out on the upper Bay twice this week. First on Tuesday, October 22nd, the crew was out collecting bacteria samples in the morning. In the afternoon, the Bullock's Reach buoy was serviced in an effort to repair a faulty data modem. Jeff captained the boat while monitoring professionals Bekki and Sara collected the data and worked on the buoy. It was a cool partly sunny day with a mild breeze out of the north-northeast. The waters were relatively calm. On Thursday, October 24th, the crew was out collecting nutrients and plankton samples, taking Secchi Disk and Par sensor water clarity measurements, conducting water column profiles using the Seabird instrument, and conducting real-time surface mapping of water quality parameters, including dissolved oxygen, chlorophyll, water temperature, salinity, and pH, all in an effort to document water quality improvements associated with NBC construction projects. In the afternoon, the temporary buoy located near Bullock's Reach was serviced. Jeff captained the boat while monitoring professionals Bekki, Steve and Mike collected the samples and data, and serviced the buoy. It was a sunny day, starting brisk but quickly warming up. There was little wind and very calm waters. The photo featured below was taken at Sabin Point showing a crane on a barge preparing to install artifical reef balls constructed of concrete. The purpose of the reef installation is to bring back fish stocks by providing habitat for them.
Bacteria Sampling
Twenty stations were sampled for fecal coliform bacteria in the Providence and Seekonk Rivers on October 16, 2019. Five stations were also sampled for enterococci. Within the five days prior to sampling, light rainfall of 0.14 inches occurred.
The geometric mean of fecal coliform results for all sites was 13 MPN/100 mL; counts were higher at the Seekonk River sites than the Providence River sites (geometric means of 60 MPN/100 mL and 7 MPN/100 mL, respectively). The maximum count (430 MPN/100 mL) was measured at the Division St. Dock site. Results from the Providence River were within state primary contact and shellfishing standards. Results from the Seekonk River exceeded state standards for primary contact and shellfishing.
The geometric mean of enterococci samples increased slightly from the previous sampling event on October 2, from 15 MPN/100 mL to 20 MPN/100 mL. Enterococci results ranged from <10 MPN/100 mL at Gaspee Point and Conimicut Point to 86 MPN/100 mL at Point St. Bridge. These enterococci results were within state standards for primary contact.
Please note: the results of NBC's fecal coliform and enterococci monitoring are for informational/research purposes only and are not intended to suggest official state compliance with bathing or shellfishing standards.

