Historical News
R/V Monitor's Blog
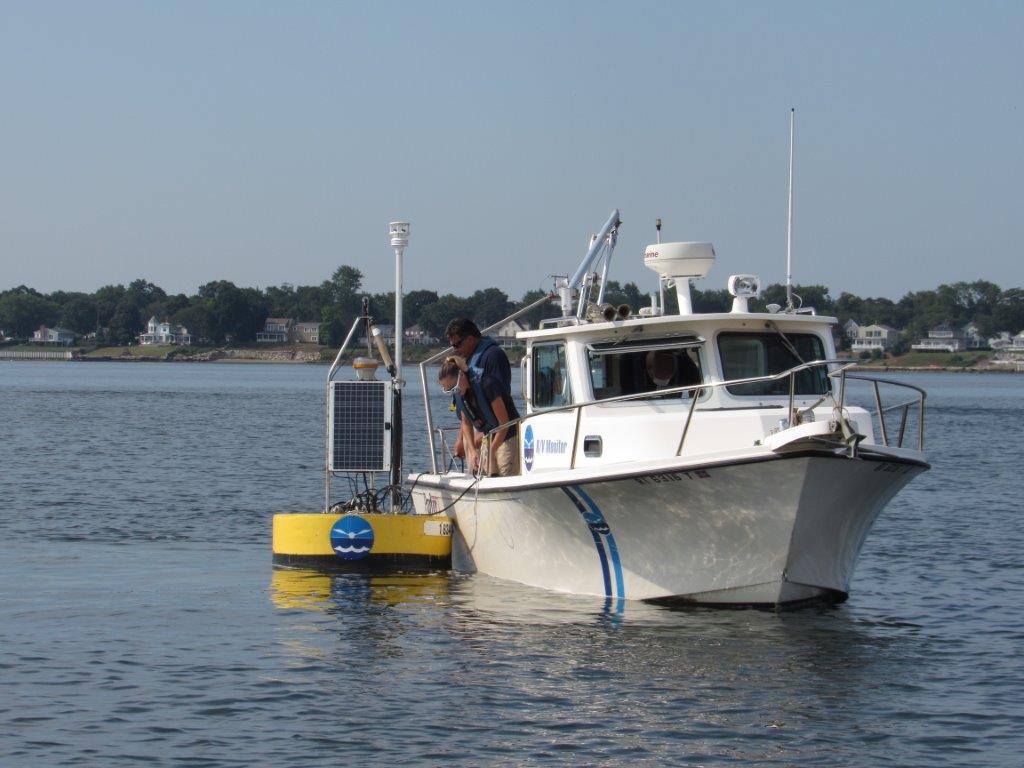
On Tuesday, August 25th, the crew of the R/V Monitor was out on the upper Bay servicing the Bullock's Reach buoy. Specifically, the buoy's sondes were changed out and vertical profiles were conducted. In addition, chlorophyll sample collections wee made at all 3 sonde depths. Jeff captained the boat while monitoring professionals Gerard and Amanda serviced the buoy and collected the samples and data. It was a sunny, warm and humid day with no wind and calm waters. The photo taken this day features the crew servicing the sonde as seen from NBC's smaller vessel, crewed by Sara and Mike.
Fixed Site Network
Phillipsdale Landing
Water quality was poor to fair this week at Phillipsdale Landing. Sondes were changed out for routine maintenance on the morning of August 20. Prior to the sonde change out, five hours of surface sonde data on August 20 was excluded from the summary due to the surface sonde being out of position. In a moderately wet week, approximately 0.88 inches of rainfall was recorded. Overall, both surface and bottom water salinity increased from the previous week with evidence of salinity stratification observed throughout the week. For the week, surface salinity averaged 24.4 ppt (range 18.4 – 28.2 ppt) while bottom salinity averaged 27.3 ppt (range 21.8 – 30.6 ppt). Both surface and bottom water temperatures decreased since the previous week; surface temperatures averaged 23.9°C (range 22.3°C – 27.0°C) while bottom temperatures averaged 23.7°C (range 22.3°C – 26.0°C). Dissolved oxygen (DO) concentrations were intermittently hypoxic (<2.9 mg/L) at the beginning of the week at the surface with bottom waters exhibiting sustained periods of hypoxia. Both surface and bottom water DO increased as the week progressed. For the week, surface water DO averaged 6.5 mg/L with a minimum of 1.9 mg/L occurring in the morning of August 16. Sustained periods of hypoxia in the bottom waters was observed at the start of the week, with the longest period (11 hours) starting in the early morning of August 16. For the week, bottom water DO averaged 4.4 mg/L with a minimum of 0.4 mg/L. Surface chlorophyll decreased from the previous week, averaging 31.8 ug/L with a maximum of 73.5 ug/L occurring in the afternoon of August 22.
Bullock Reach
Water quality at Bullock Reach was poor to fair this week. Overall, salinity at all depths increased slightly from the previous week; surface salinity averaged 29.8 ppt (range 28.0 – 30.6 ppt), mid water salinity averaged 30.3 ppt (range 24.7 – 31.1 ppt) and bottom salinity averaged 31.4 ppt (range 30.2 – 32.3 ppt). Evidence of salinity stratification was observed at the beginning of the week, with more mixing in the water column occurring towards the end of the week. Water temperatures at all depths decreased since the previous week; surface waters ranged from 22.3°C to 24.7°C and averaged 23.2°C, mid depth waters ranged from 21.7°C to 24.3°C and averaged 22.9°C, while bottom waters ranged from 20.2°C to 23.5°C and averaged 22.0°C. Much like salinity stratification, temperature stratification was observed at the beginning of the week with more mixing occurring towards the end of the week. This week dissolved oxygen (DO) concentrations were periodically hypoxic (<2.9 mg/L) in only the bottom waters. For the week, surface DO averaged 6.6 mg/L with a minimum of 4.0 mg/L, while mid depth DO averaged 5.7 mg/L with a minimum of 3.3 mg/L. Sporadic hypoxia was observed at the bottom waters earlier in the week, with DO increasing as the week progressed. Bottom DO averaged 4.4 mg/L for the week, with a minimum of 1.3 mg/L occurring late night on August 16. Chlorophyll at all depths decreased this week; surface chlorophyll averaged 12.6 ug/L with a maximum of 192.9 ug/L, while mid and bottom waters averaged 6.3 ug/L and 16.6 ug/L, respectively.
Water Column Profiles
The NBC's Seabird profiling instrument was sent to the manufacturer for routine servicing over the winter; due to the COVID-19 pandemic, the return of the instrument has been greatly delayed. In the absence of this instrument, the NBC Environmental Monitors used a YSI EXO sonde to collect data on surface and bottom conditions at seven typical Seabird profiling sites on August 13. Settings on this instrument were not optimized for measurements of a true profile, rather, the goal of the survey was to obtain stable estimates of conditions at the surface and bottom only. These data are summarized here, and raw data are available upon request. Conditions were relatively dry prior to sampling; only 0.01 inches of rainfall occurred in the five days prior to sampling. Strong stratification was present at most sites and surface water temperatures were elevated throughout the Bay.
Salinities were highest at Conimicut Point, measuring 28 ppt at the surface and 31 ppt at the bottom. The lowest salinities were observed at Phillipsdale Landing, with surface salinity averaging 16 ppt and bottom salinity averaging 25 ppt. Surface temperatures were greatest at Edgewood Shoal, measuring 28.1°C, while bottom temperatures were warmest at Pawtuxet Cove, measuring 27.6°C. The coldest waters were observed at Conimicut Point, ranging from 27.1°C at the surface to 24.5°C at the bottom.
Dissolved oxygen (DO) concentrations were poor this week; bottom waters at six sites were below the hypoxia threshold (i.e., ≤ 2.9 mg/L). The lowest estimate of bottom DO was 0.65 mg/L at Phillipsdale Landing; the highest bottom DO of 7.34 mg/L was observed at Pawtuxet Cove. Surface DO ranged from a high of 13.4 mg/L to a low of 3.2 mg/L; the minimum was measured at India Point Park. Chlorophyll was elevated at all sites, with maximum concentrations of > 100 ug/L observed at all sites except India Point Park.
Fixed Site Network
Phillipsdale Landing
Water quality was poor this week at Phillipsdale Landing. In a mostly dry week, approximately only 0.01 inches of rainfall was recorded. Overall, surface salinity at the site increased throughout the week, with salinity in the bottom waters remaining steady. For the week, surface salinity averaged 18.9 ppt (range 10.5 – 23.7 ppt) while bottom salinity averaged 24.9 ppt (range 17.1 – 30.0 ppt). Prolong periods of salinity stratification were observed at Phillipsdale Landing this week. Surface water temperatures increased slightly since the previous week; surface temperatures ranged from 23.9°C to 29.5°C and averaged 27.1°C. Bottom water temperatures were similar to the previous week, ranging from 24.2°C to 28.6°C and averaging 26.7°C. Dissolved oxygen (DO) concentrations were hypoxic (<2.9 mg/L) in both surface and bottom waters for large portions of the week. Surface waters occasionally demonstrated periods of hypoxia, averaging 7.9 mg/L with a minimum of 1.0 mg/L occurring in the morning of August 14. Sustained periods of hypoxia were observed throughout the week at the bottom waters, with the longest period (49.5 hours) starting late night on August 12. For the week, bottom water DO averaged 2.1 mg/L with a minimum of 0.1 mg/L observed in the morning of August 14. Surface chlorophyll increased from the previous week, averaging 64.6 ug/L with a maximum of 121.1 ug/L occurring in the afternoon of August 12.
Bullock Reach
Water quality at Bullock Reach was poor to fair this week. Sondes were changed out for routine maintenance on the morning of August 12. Overall, salinity at all depths increased from the previous week; surface salinity averaged 28.2 ppt (range 23.4 – 29.3 ppt), mid water salinity averaged 29.3 ppt (range 26.8 – 31.1 ppt) and bottom salinity averaged 31.2 ppt (range 25.6 – 32.3 ppt). Evidence of salinity stratification was observed throughout the week. Both surface and mid water temperatures were similar to the previous week; surface waters ranged from 24.1°C – 28.2°C and averaged 26.8°C, while mid water temperatures ranged from 24.2°C to 27.8°C and averaged 26.2°C. Bottom temperatures decreased compared to last week, with temperatures averaging 24.5°C and ranging from 20.8°C – 26.8°C. Dissolved oxygen (DO) concentrations were hypoxic (<2.9 mg/L) in both mid and bottom waters. For the week, surface DO averaged 8.4 mg/L with a minimum of 3.8 mg/L, while mid-depth DO averaged 6.1 mg/L with a minimum of 1.8 mg/L. Starting late night on August 13, sustained period of hypoxia (30 hours) was observed in the bottom waters at this site, with bottom DO averaging 3.3 mg/L and a minimum of 1.0 mg/L. Surface chlorophyll increased this week, averaging 14.7 ug/L and with a maximum of 134.2 ug/L observed midday on August 13. Finally, mid-depth chlorophyll averaged 8.3 ug/L, while bottom chlorophyll averaged 27.4 ug/L.
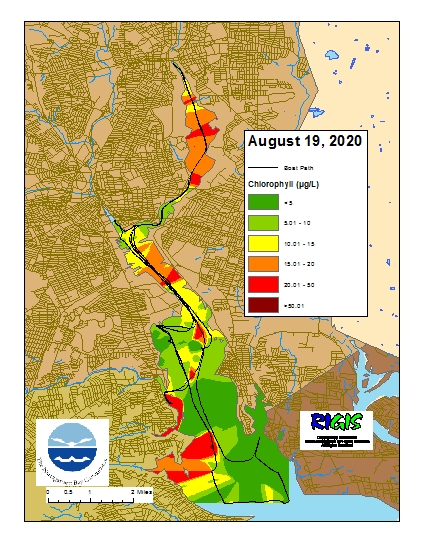
Surface Mapping
Data
were collected on August 19, 2020 while the R/V Monitor was underway collecting
bacteria samples and performing vertical profiles in the Providence and Seekonk
River estuaries. The chlorophyll concentrations were variable from poor to good
in areas surveyed. From north to south, average chlorophyll concentrations were
as follows: Seekonk River (13.01 µg/L), Upper Providence River (10.86 µg/L),
Edgewood Shoals area (6.12 µg/L), Pawtuxet River area (17.93 µg/L), and Lower
Providence River area (9.37 µg/L). Overall, chlorophyll ranged between 0.60
µg/L and 73.40 µg/L with an overall average of 11.84 µg/L. The
chlorophyll data from this date are presented in the map below: