Historical News
Phytoplankton Sampling
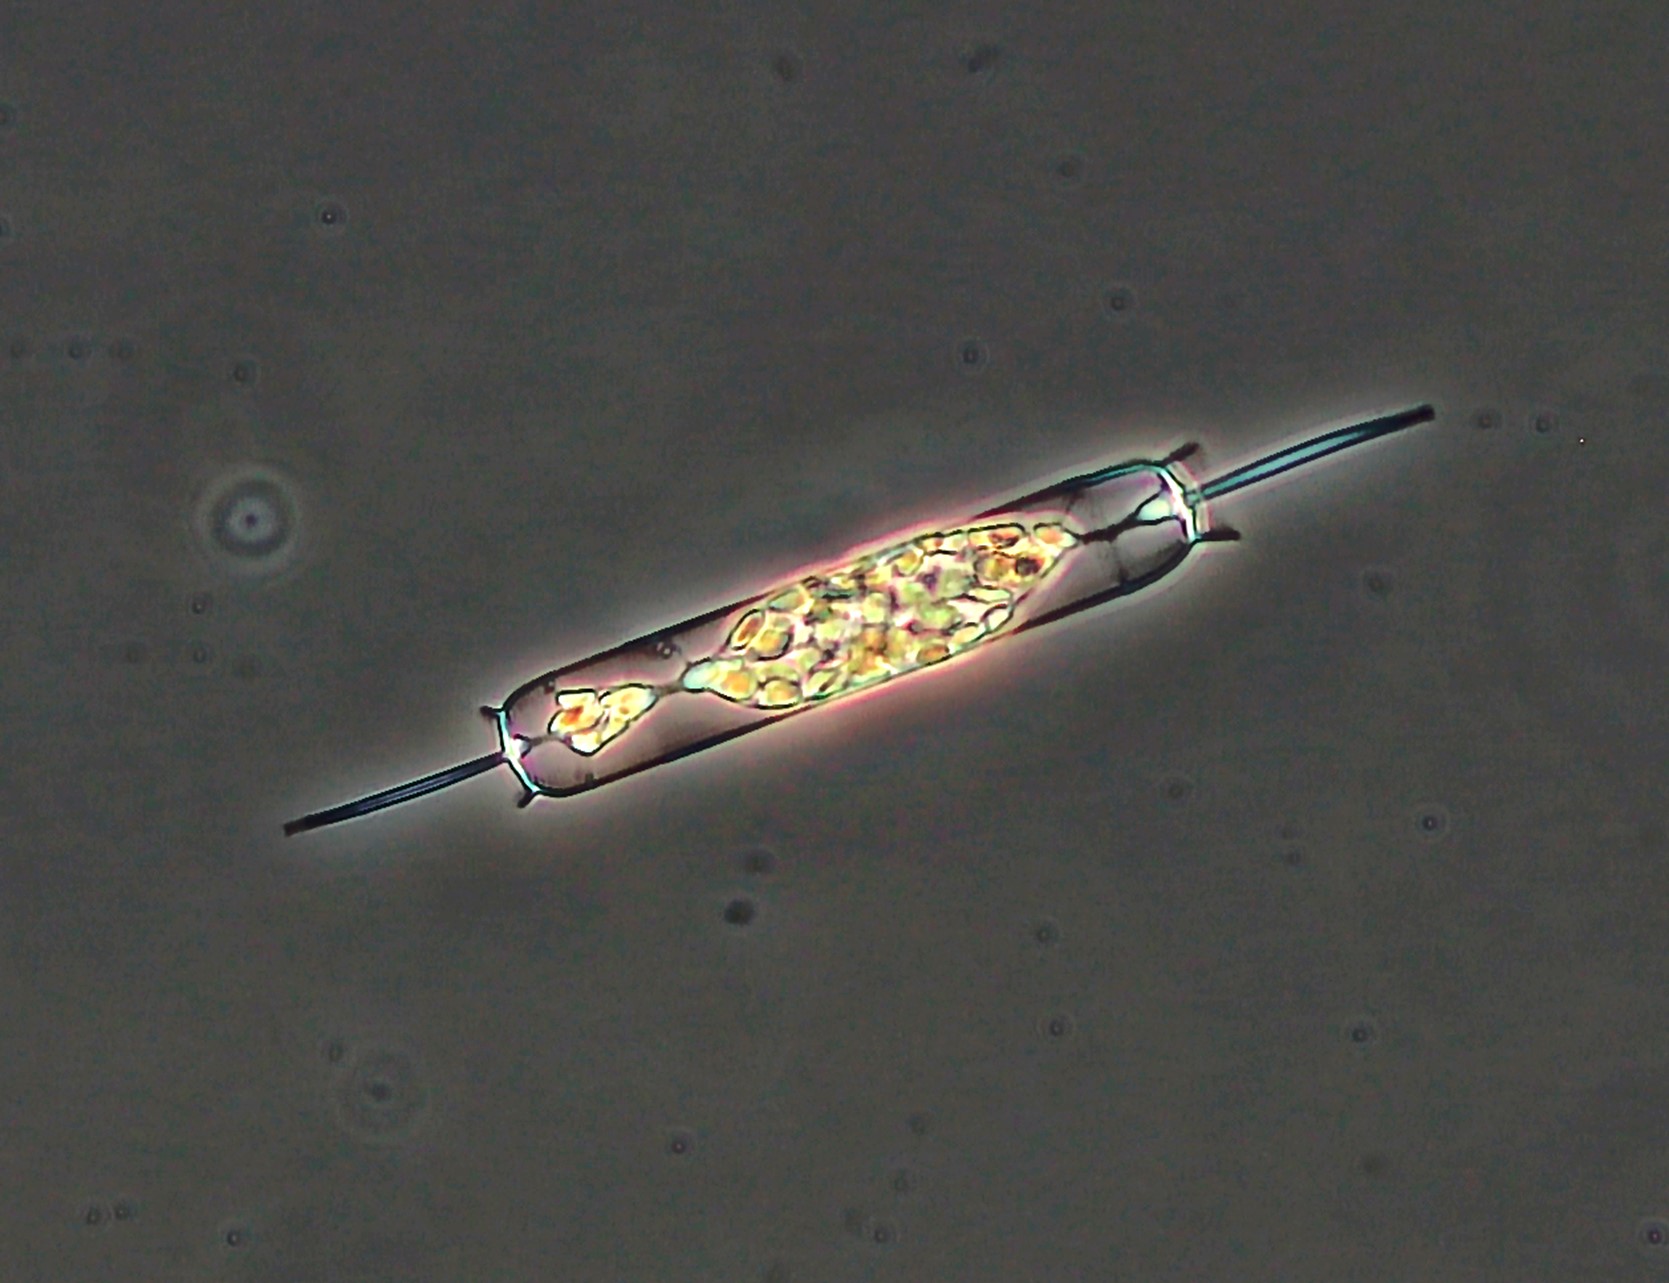
Phytoplankton samples were collected on August 11, 2021 at Bullock Reach and analyzed in the laboratory shortly after collection. Sondes data revealed the surface water temperature was 23.34°C, salinity was 42.43 psu, and chlorophyll a was 8.2 ug/L. The plankton tow net sample was filterable with a 20 micron mesh. The filtrate was a light green/brown color and had a quick filter time. The tow net sample was analyzed qualitatively for microorganisms using phase contrast microscopy. The whole water sample was analyzed quantitatively under 200x phase contrast microscopy. A Hensen Stempel pipette was used to accurately deliver 1ml of sample to a Sedge-wick Rafter chamber. This analysis revealed a total of 8,332,000 cells per Liter. The flagellates were found at 5,636,000 cells/L. The most predominant phytoplankton genus was Leptocylindrus spp. at 2,112,000 cells/L. Other representative genera include Prorocentrum spp., Skeletonema spp., Chaetoceros spp., and Thalassiosira spp.
200x phase contrast micrograph of Ditylum brightwellii.
Surface Mapping
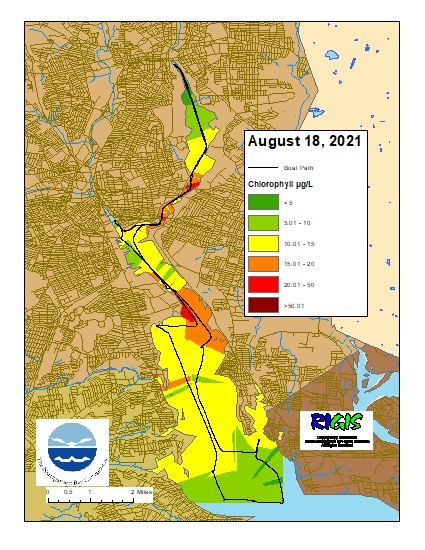
Data were collected on August 18, 2021 while the R/V Monitor was underway collecting bacteria samples in the Seekonk and Providence River estuaries. The average chlorophyll concentrations were fair in the areas surveyed. From north to south, average chlorophyll concentrations were as follows: Seekonk River (12.46 µg/L), Upper Providence River (13.45 µg/L), Edgewood Shoals area (12.40 µg/L), Pawtuxet River area (11.66 µg/L), and Lower Providence River (8.52 µg/L). Overall, chlorophyll ranged between 1.69 µg/L and 30.97 µg/L with an overall average of 11.44 µg/L. The chlorophyll data from this date are presented in the map below:
R/V Monitor's Blog
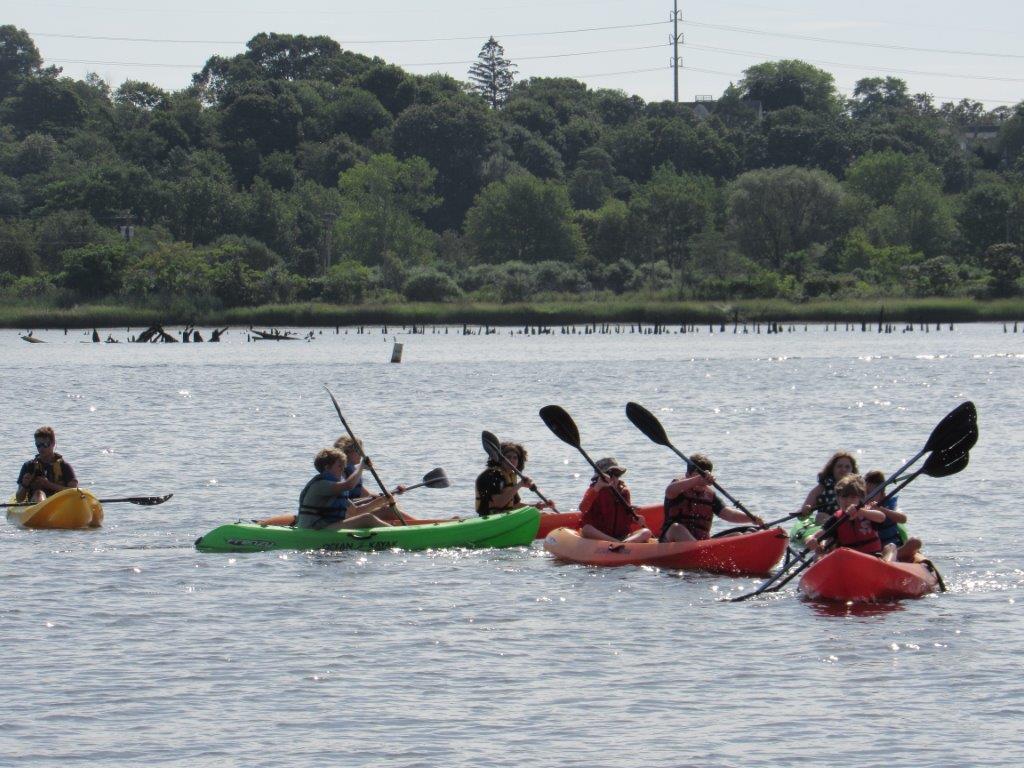
On Wednesday, August 18th, the crew of the R/V Monitor was out on the upper bay collecting bacteria samples, taking Secchi Disk and Par sensor water clarity measurements, conducting water column profiles using the Seabird instrument, and conducting real-time surface mapping of water quality parameters, including dissolved oxygen, chlorophyll, water temperature, salinity, and pH, all in an effort to document water quality improvements associated with NBC construction projects. Jeff T. captained the boat while monitoring professionals Daryll and Jeff O. collected the samples and data. It was a mostly cloudy warm and humid day. The day began with no breeze and calm waters but a light breeze developed later in the morning and created a mild chop on the water. The photo below was taken at Green Jacket Shoal and features some young kayakers.
Water Column Clarity
Water clarity was measured at six locations in the Providence Rivers on July 28, 2021. Conditions this week were moderately wet with 0.19 inches of rainfall recorded at T.F. Green in the five days leading up to the survey day. Compared to the previous week, there was a slight increase in water clarity across all sites measured this week. Overall, sites surveyed this week averaged 1.79 meters Secchi depth, compared to 1.65 meters on July 21, 2021. The lowest clarity (1.23 meters) was measured at Pawtuxet Cove. Overall, a slight gradient of increasing water clarity from north to south was observed this week.
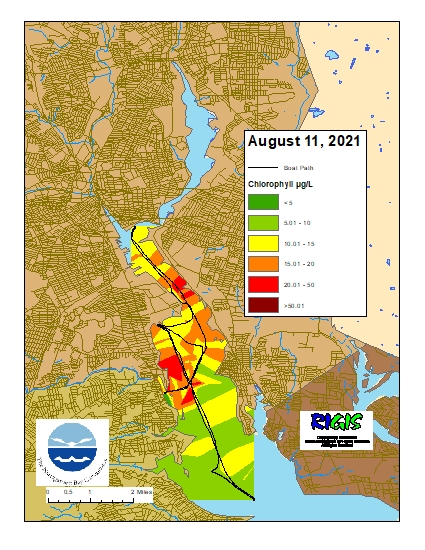
Surface Mapping
Data
were collected on August 11, 2021 while the R/V Monitor was underway collecting
nutrient samples in the Providence River estuary. The average chlorophyll
concentrations were fair in the areas surveyed. From north to south,
average chlorophyll concentrations were as follows: Upper Providence River (13.58
µg/L), Edgewood Shoals area (14.74 µg/L), Pawtuxet River area (13.30 µg/L), and
Lower Providence River (7.99 µg/L). Overall, chlorophyll ranged between 2.41
µg/L and 32.08 µg/L with an overall average of 11.80 µg/L. The chlorophyll data
from this date are presented in the map below: