Historical News
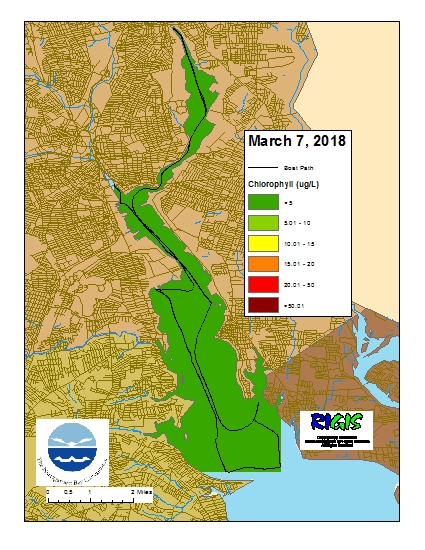
Surface Mapping
Data was collected on March 7, 2018 while the R/V Monitor was underway collecting bacteria samples and performing vertical profiles in the Providence and Seekonk River estuaries. The chlorophyll concentrations were good in areas surveyed. From north to south, average chlorophyll concentrations were as follows: Seekonk River (2.99 µg/l), Upper Providence River (2.51 µg/l), Edgewood Shoals area (2.38 µg/l), Pawtuxet River area (2.47 µg/l), and the Lower Providence River (2.38 µg/l). Overall, chlorophyll ranged between 1.0 µg/l and 4.0 µg/l with an overall average of 2.62 µg/l. The chlorophyll data from this date is presented in the map below:
R/V Monitor's Blog
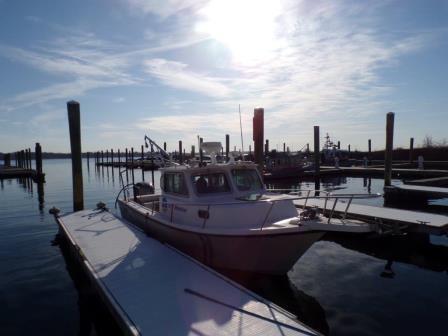
On Wednesday, February 28th, the crew of the R/V Monitor was out on the upper Bay collecting nutrients and plankton samples, taking Secchi Disk and Par sensor water clarity measurements, and conducting real-time surface mapping of water quality parameters, including dissolved oxygen, chlorophyll, water temperature, salinity, and pH, all in an effort to document water quality improvements associated with NBC construction projects. Sara captained the boat while monitoring professionals Bekki and Mike collected the samples and data. The weather was sunny but chilly, with no wind in the morning but becoming very windy by the afternoon. With the wind came quite choppy waters. The below photo shows the R/V Monitor at its berth this day.
Water Column Clarity
Water clarity was measured at eight locations in the Providence and Seekonk Rivers on February 28, 2018. A total of 1.23 inches of precipitation occurred during the five days prior to sampling. Overall, clarity increased from the previous week. The overall Secchi depth averaged 3.4 meters, a 0.6 m increase from the previous sampling. The largest increase (1.5 m) occurred at Bullock Reach. Secchi depth ranged from 1.4 m at Phillipsdale Landing in the Seekonk River to 5.2 m at Edgewood Shoals, in the Providence River. While water clarity was lower in the Seekonk River compared to the Providence River, there was no evidence of a north to south water clarity gradient in the Providence River.
Phytoplankton Sampling
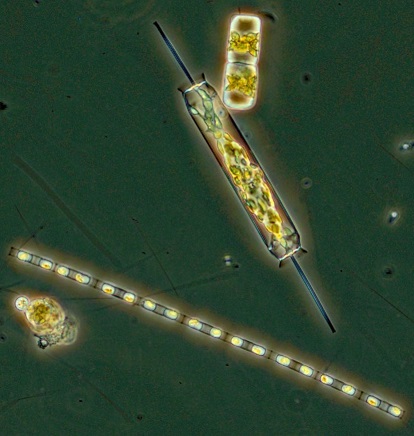
Phytoplankton samples were collected at Bullock Reach on February 14, 2018 and analyzed in the laboratory shortly after collection. It was a cloudy and calm day with a south westerly wind on Narragansett Bay. Water temperature was 2.6 °C, salinity was 15.12 psu, and chlorophyll a was 0.5 µg/L.
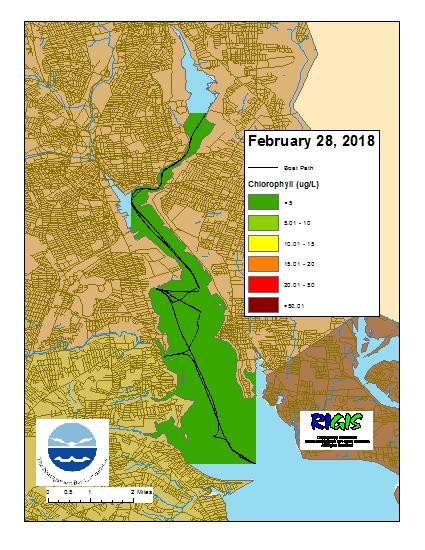
Surface Mapping
Data was collected on February 28, 2018 while the R/V Monitor was underway collecting nutrient samples and performing vertical profiles in the Providence and Seekonk River estuaries. The chlorophyll concentrations were good in areas surveyed. From north to south, average chlorophyll concentrations were as follows: Seekonk River (2.22 µg/l), Upper Providence River (1.68 µg/l), Edgewood Shoals area (1.33 µg/l), Pawtuxet River area (1.73 µg/l), and the Lower Providence River (1.28 µg/l). Overall, chlorophyll ranged between non-detectable and 6.3 µg/l with an overall average of 1.59 µg/l. The chlorophyll data from this date is presented in the map below: