Historical News
R/V Monitor's Blog
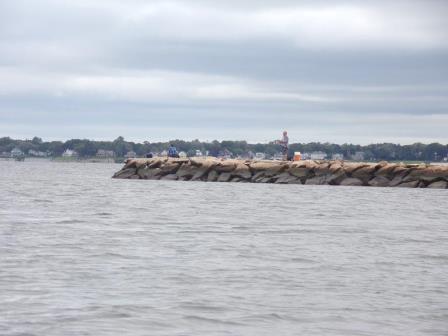
On Wednesday, September 19th, the crew of the R/V Monitor was out on the upper Bay collecting bacteria samples, taking Secchi Disk and Par sensor water clarity measurements, conducting water column profiles using the Seabird instrument, and conducting real-time surface mapping of water quality parameters, including dissolved oxygen, chlorophyll, water temperature, salinity, and pH, all in an effort to document water quality improvements associated with NBC construction projects. Jeff captained the boat while monitoring professionals Stephen, Sara and Heather collected the samples and data. The weather was a bit cool and drizzly with calm waters in the morning, but the waters became mildly choppy in the afternoon as a breeze from the northeast strengthened. Below is photo taken this day of someone fishing from the breakwall at Pawtuxet Cove.
Phytoplankton Sampling
Phytoplankton samples were collected at Bullock's Reach on September 12, 2018 and analyzed in the laboratory shortly after collection. It was a stale and foggy day on Narragansett Bay. Sondes data revealed the surface water temperature was 21.59oC, salinity was 29.57 psu, and chlorophyll a was 6.1 ug/L. The plankton tow net sample was filterable with a 20 micron mesh. The filtrate was light tan in color with a quick filter-ability time. The tow net sample was analyzed qualitatively for microorganisms using 100x phase contrast microscopy. The whole water sample was analyzed quantitatively under 200x phase contrast microscopy. A Hensen Stempel pipette was used to accurately deliver 1ml of sample to a Sedge-wick Rafter chamber. This analysis revealed a total of 1,462,000 cells per Liter. The most predominant phytoplankton was Leptocylindrus spp. at 1,253,000 cells/L. The flagellates were found at 202,000 cells/L and other representative genera include Chaetoceros spp. and Akashiwo sanguineum sp.
200x phase contrast image of a Chaetoceros spp.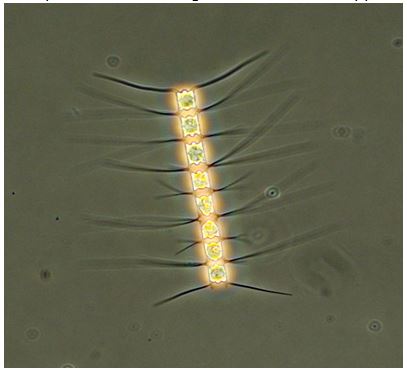
Nutrients Sampling
Seven bay stations and seven river stations were sampled for nutrients on August 29 and 30, 2018. Surface and bottom waters were sampled at all seven bay stations. No precipitation was recorded in the five days prior to sampling.
Among the river stations sampled, total nitrogen (TN) ranged from 526 ppb at the Ten Mile River at Roger Williams Avenue location to 1565 ppb at the Pawtuxet River at Broad Street. Highest total dissolved nitrogen (TDN) and dissolved inorganic nitrogen (DIN) concentrations (>1400 ppb) were also observed at Pawtuxet River at Broad Street. Lowest TDN (529 ppb) occurred at the Moshassuck River at Higginson Avenue, while the lowest DIN (370 ppb) occurred at the Ten Mile River at Roger Williams Avenue.
Among bay site surface waters, Pawtuxet Cove had the highest recorded TN, TDN, and DIN concentrations, with results of 1620 ppb, 1200 ppb, and 862 ppb, respectively. Lowest TN (654 ppb) was observed at Conimicut Point. Edgewood Yacht Club had the lowest measured TDN (170 ppb) and DIN (15 ppb). Chlorophyll a averaged 19.2 ug/L throughout the bay, ranging from 1.1 ug/L at Pawtuxet Cove to 42.7 ug/L at Phillipsdale Landing.
Results from nutrient sampling completed on September 12, 2018 are pending final analysis from the NBC Laboratory. The next anticipated date of sampling is September 26, 2018.
Nutrients Sampling
Eight bay stations and fourteen river stations were sampled for nutrients on August 16, 2018. Surface and bottom waters were sampled at one bay station, while all other bay stations were sampled at the surface only. Within the five days prior to sampling, 2.37 inches of cumulative rainfall was recorded. However, no rainfall occurred on the day of sampling.
Among the river stations sampled, the highest average total nitrogen (TN), total dissolved nitrogen (TDN), and dissolved inorganic nitrogen (DIN) concentrations were observed at the Ten Mile River sampling location at Central Avenue, at 1490 ppb, 1420 ppb, and 1020 ppb, respectively. The lowest TN concentration (509 ppb) was observed at the Moshassuck River at Higginson Avenue, while the lowest TDN concentration (414 ppb) was observed at the Ten Mile River site at Roger Williams Avenue. The Warren Reservoir/Kickemuit River had the lowest DIN, at 20 ppb.
Among the bay sites, Pawtuxet Cove had the highest recorded TN, TDN, and DIN concentrations, with results of 1,090 ppb, 912 ppb, and 643 ppb, respectively. Edgewood Shoals had the lowest TN (773 ppb) and TDN (350 ppb) results, while Bullock Reach had the lowest DIN concentration (167 ppb). Chlorophyll a averaged 7.46 ug/L throughout the bay, ranging from 3.0 ug/L at Pawtuxet Cove to 13.9 ug/L at Edgewood Shoals.
Results from nutrient sampling completed on August 29-30 and September 12, 2018 are pending final analysis from the NBC Laboratory. The next anticipated date of sampling is September 26, 2018.
Water Column Profiles

