Week of October 20 - 26, 2019
Fixed Site Network
Phillipsdale Landing
Water quality at Phillipsdale Landing was good this week. Minor rainfall of approximately 0.5 inches occurred over October 22 and 23, and Blackstone River flows generally decreased over the course of the week. Surface salinity subsequently increased as the week progressed, averaging 10.5 ppt, and ranging from 4 ppt to 23 ppt; variability in surface salinity also increased following the mid-week rain. Bottom salinity was higher than the surface all week, averaging 25.3 ppt and ranging 9 – 31 ppt. Water temperatures were relatively steady, averaging 14.1°C at the surface and 15.0°C at the bottom overall, just slightly cooler than the previous week. In terms of dissolved oxygen (DO) conditions, hypoxia (DO <2.9 mg/L) was not observed at any depths. Surface DO averaged 8.3 mg/L with a minimum of 6.0 mg/L, while bottom DO averaged 6.0 mg/L with a minimum of 4.6 mg/L. Surface chlorophyll-a was low for most of the week, with an overall average of 2.5 ug/L and a maximum of 32.5 ug/L; this high result was a single reading, not indicative of lasting bloom conditions. Note that tidal fluctuations and Blackstone River flow greatly influence water column DO, temperature, and salinity at this location; in addition, approximately 3.5 hours of surface data from the morning of October 20 has been excluded from this analysis as the depth readings indicated the sonde was hung up and out of the water.
Bullock Reach
Bullock Reach data beyond October 19 are not currently available for posting. The sondes are still deployed and internally logging data, but a careful review of these data is underway. Data will be posted as soon as possible.
Week of November 3 - 9, 2019
R/V Monitor's Blog
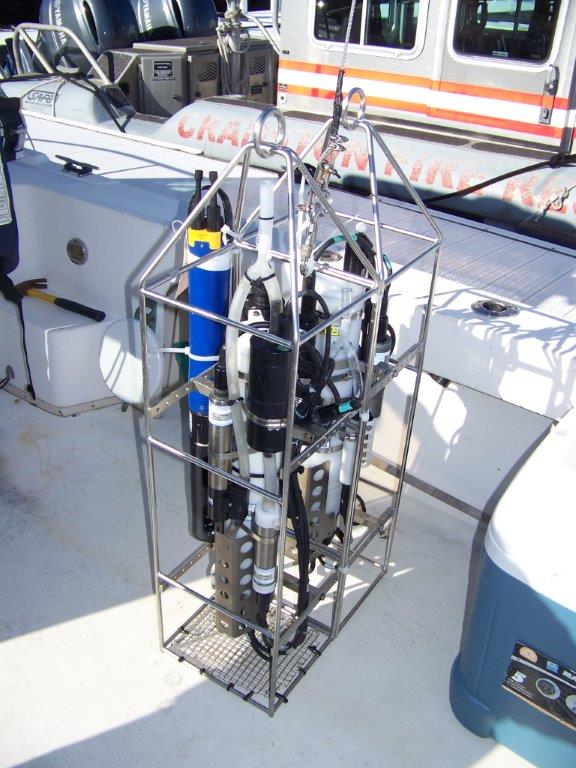
The R/V Monitor was out on the upper Bay twice this week. First, on Tuesday, November 5th, the crew was out servicing the Bullock's Reach and temporary buoys. Jeff captained the boat while monitoring professionals Bekki and Mike serviced the buoys. It was a sunny day with no wind and calm waters. On Wednesday, November 6th , the crew was collecting nutrients samples, taking Secchi Disk and Par sensor water clarity measurements, conducting water column profiles using the Seabird instruments, and conducting real-time surface mapping of water quality parameters, including dissolved oxygen, chlorophyll, water temperature, salinity, and pH, all in an effort to document water quality improvements associated with NBC construction projects. Jeff captained the boat while monitoring professionals Fern and Mike collected the samples and data. It was another sunny day with a slight breeze out of the west-northwest. There were some small waves out on the Bay this day, and a few elusive seals were spotted. The featured photo shows NBC's Seabird instruments being readied for deployment this day.
Week of November 3 – November 9, 2019
Surface Mapping
Data were collected on November 6, 2019 while the R/V Monitor was underway collecting nutrient samples in the Seekonk and Providence River estuaries. The chlorophyll concentrations were good. From north to south, average chlorophyll concentrations were as follows: Seekonk River (2.98 µg/L), Upper Providence River (2.40 µg/L), Edgewood Shoals area (2.35 µg/L), Pawtuxet River area (2.88 µg/L), and Lower Providence River area (3.18 µg/L). Overall, chlorophyll ranged between 0.80 and 5.20 µg/L with an overall average of 2.79 µg/L. The chlorophyll data from this date are presented in the map below: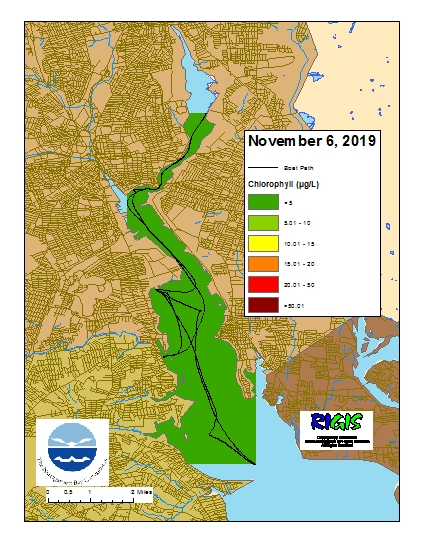
Week of October 20 - 26, 2019
Water Column Clarity
Water clarity was measured at six locations in the Providence and Seekonk Rivers on October 24, 2019. Approximately 0.53 inches of rainfall occurred the day prior to the survey. The average Secchi depth increased since the last survey on September 25, from 1.5 m to 3.3 m. All sites exhibited increased clarity since the previous survey, with the greatest increase (2.8 m) observed at Conimicut Point. Water clarity ranged from 2.3 m at Pawtuxet Cove to 4.7 m at Conimicut Point. Overall, water clarity in Upper Narragansett Bay increased from north to south.
Week of October 13 - 19, 2019
Fixed Site Network
Phillipsdale Landing
Water quality was good to fair this week at Phillipsdale Landing. The sondes were changed for routine maintenance on the morning of October 16. Approximately 1.8 inches of precipitation occurred over the course of the week, nearly all on October 16 and 17. This rain and subsequent increases in freshwater river flow contributed to declines in salinities mid-week. Surface salinity averaged 16.5 ppt, and ranged from 2 ppt to 28 ppt. Some of this week’s bottom salinity data were deemed suspect by NBC scientists. These data appeared anomalously low, believed to be due to bottom debris and snails that were observed in the cage around the sensors when the sonde was retrieved on October 16. The remaining data (October 16 late morning – October 19) averaged 20.5 ppt for bottom salinity, ranging 3 – 31 ppt. Water temperatures cooled slightly this week, averaging 15.4°C at the surface and 16.0°C at the bottom overall. Hypoxic conditions (dissolved oxygen [DO] <2.9 mg/L) were observed in the bottom waters briefly on October 16 (30 min maximum duration), where DO concentrations hit a minimum of 1.4 mg/L. Surface DO remained above the hypoxia threshold all week, averaging 7.8 mg/L with a minimum of 5.8 mg/L. Surface chlorophyll-a was low for most of the week, with an overall average of 5.1 ug/L and a maximum of 19.4 ug/L. Note that tidal fluctuations and Blackstone River flow greatly influence water column DO, temperature, and salinity at this location.
Bullock Reach
Bullock Reach data for late October are in review by NBC Scientists – at this time the only data available are partial for this week, ending mid-day on October 19. Additional data will be posted and discussed as they are reviewed.
Good water quality was observed this week at Bullock Reach. Water temperatures continue to cool, averaging 15.7°C at the surface and mid depths and 15.4°C at the bottom. Surface salinity averaged 28.3 ppt, ranging from 24 ppt to 30 ppt. Salinity values at the mid and bottom sondes averaged 29.9 ppt and 31.9 ppt, respectively. Salinity at all depths decreased over the course of the week; this was most pronounced for the surface waters, most impacted by the mid-week rainfall. There were no recorded measurements of hypoxia (DO <2.9 mg/L) at any depths. For the week overall, surface DO averaged 8.0 mg/L with a minimum of 7.3 mg/L, mid averaged 7.7 mg/L with a minimum of 7.3 mg/L, and bottom averaged 7.5 mg/L with a minimum of 6.8 mg/L. Chlorophyll at all depths remained low this week, averaging 3.4 ug/L at the surface, 2.7 ug/L at the mid, and 3.5 ug/L at the bottom.

