Historical News
R/V Monitor's Blog
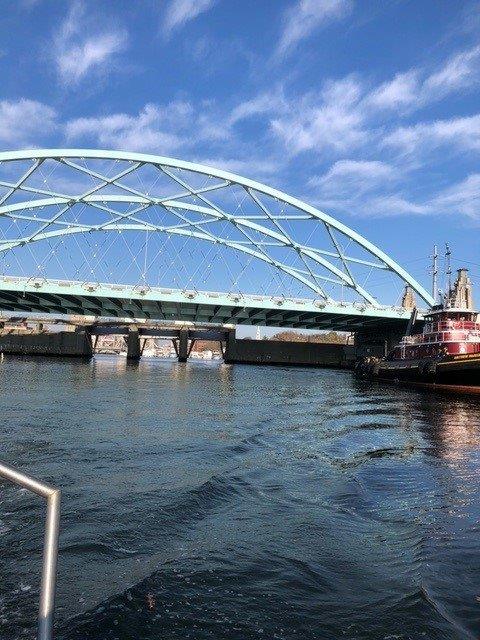
On Wednesday, November 23rd, the crew of the R/V Monitor was out on the upper Bay collecting bacteria samples, taking Secchi Disk water clarity measurements, and conducting real-time surface mapping of water quality parameters, including dissolved oxygen, chlorophyll, water temperature, salinity, and pH, all in an effort to document water quality improvements associated with NBC construction projects. Jeff captained the boat while monitoring professionals Tyler and Steve collected the samples and data. It was sunny but brisk with a light wind out of the north. The crew noted there was a strong outgoing tide this day. The featured photo taken shows the I-195 Iway bridge and hurricane barrier.
Bacteria Sampling
On November 9, fourteen stations were sampled for fecal coliform bacteria in the Providence River. Four of these stations were also sampled for enterococci bacteria. No precipitation was recorded at TF Green in the five days prior to sampling.
| | Fecal Coliform | Enterococci |
| Primary Contact1 | Geometric mean ≤50 MPN/100 mL | Geometric mean ≤35 colonies/100 mL |
| Shellfishing | Geometric mean ≤14 MPN/100 mL | NO ENTEROCOCCI CRITERIA |
Water Column Clarity
Water clarity was measured at seven locations in the Providence River estuary on November 17. Rainfall totaling 1.49 inches was recorded at TF Green in the five days prior to the survey. Secchi depth averaged 3.2 meters, compared to 3.5 meters on the previous survey (November 9). The lowest clarity this week (2.0 meters) was measured at India Point Park and Pawtuxet Cove, while the greatest clarity (4.6 meters) was measured at Bullock Reach. There was a general north-to-south gradient of increasing water clarity among the sites this week.
Surface Mapping
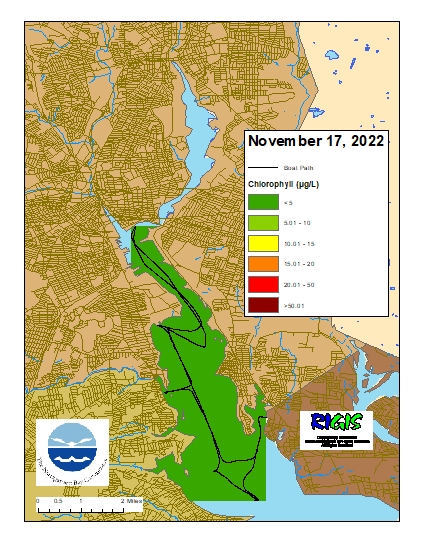
Data were collected on November 17, 2022, while the R/V Monitor was underway collecting nutrient samples in the Providence River estuary. The average chlorophyll concentrations were good in the areas surveyed. From north to south, average chlorophyll concentrations were as follows: Upper Providence River (0.36 µg/L), Edgewood Shoals area (0.25 µg/L), Pawtuxet River area (0.57 µg/L), and Lower Providence River (0.66 µg/L). Overall, chlorophyll ranged between non-detectable and 1.29 µg/L with an overall average of 0.51 µg/L. The chlorophyll data from this date are presented in the map below:
Phytoplankton Sampling
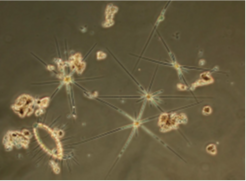
Phytoplankton samples were collected on November 17, 2022 at Bullock Reach and analyzed in the laboratory shortly after collection. It was partly sunny and chilly on Narragansett Bay with a slight chop and windy conditions. Sondes data revealed the surface water temperature was 12.58⁰C, salinity was 28.23 psu, and chlorophyll a was 0.75 ug/L. The plankton tow net sample was filterable with a 20 micron mesh. The filtrate was a light tan color and had a quick filter time. The tow net sample was analyzed qualitatively for microorganisms using phase contrast microscopy. The whole water sample was analyzed quantitatively under 200x phase contrast microscopy. A Hensen Stempel pipette was used to accurately deliver 1ml of sample to a Sedge-wick Rafter chamber. This analysis revealed a total of 110,000 cells per Liter. The micro flagellates were found at 96,000 cells/L. The most predominant phytoplankton genus was Skeletonema spp. at 11,000. Representative genera in the tow net sample include Chaetoceros spp. and Pseudo-nitzschia spp. (the wide species).
200x phase contrast image of Chaetoceros spp.