Modeling Project
Regional Ocean Modeling System for Upper Narragansett Bay
Management of a multi-use resource like Narragansett Bay requires state-of-the-art models supported by state-of-the-art data sets. Since the turn of the century, NBC has invested in the University of Rhode Island Graduate School of Oceanography (URI-GSO) students and faculty to develop a Narragansett Bay (NB) version of the Regional Ocean Modeling System (ROMS), and the data sets needed to constantly test and improve the model. Alongside the National Oceanic and Atmospheric Administration (NOAA), the NBC has supported the collection of unprecedented spatially-temporally detailed hydrographic data sets which have been used in guiding model development, all with the goal of characterizing circulation and biogeochemical transport in the Bay and the water quality impact of various nitrogen reductions from all major wastewater treatment facilities (WWTFs).
What is ROMS?
ROMS is a public domain, three-dimensional hydrodynamic-transport model for coastal systems. The model solves a coupled set of conservation equations for the circulation and transport of salt and temperature within estuarine waters subject to an array of environmental forcing factors (e.g., tides, winds, runoff, density, air temperature, etc.). ROMS is designed to work in challenging coastal systems like Narragansett Bay, as it can readily represent changes in water depth and represent 3-D flows that are so important in our local estuary. Since ROMS is open to the public domain, it is constantly being utilized, tested and improved by scientists around the world. Because of this, many liken ROMS to a living, evolving organism.
Data Collection
 All models are only as good as the data used to drive and constrain numerical (or computational) solutions. The Coastal Hydrodynamics Group at the URI-GSO, led by Dr. Chris Kincaid, has collected unparalleled flow data on the upper Bay. In collaboration with NBC, NOAA, Save the Bay Girls in Science Program and others, over 10 million flow measurements have been made in the chronically low oxygen waters of the Edgewood Shoals region of the estuary alone.
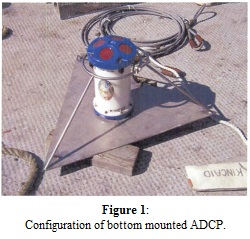
The NBC began this effort by funding Dr. Kincaid and D. Bergondo (URI PhD student) to collect hydrographic data in the Providence and Seekonk Rivers during 2001, 2002 and 2005 using Acoustic Doppler Current Profilers (ADCPs).An ADCP is an instrument that measures water column velocities by sending out acoustic pulses that bounce off of particulate matter in the water column (Figure 1).The energy returning to the instrument is Doppler shifted based on whether particles are moving toward or away from the instrument, thereby providing a real-time indication of water column flow patterns. By completing underway surveys, achieved by attaching ADCPs to small vessels and driving repeat surveys for 16 hour periods, Dr. Kincaid and students were able to map flow structures in these rivers, identifying jets and eddy structures in amazing detail. An eddy, or small gyre, is a parcel of water that moves in a circular motion, typically counter to the main flow.One eddy of particular importance was found to be present on Edgewood Shoals, an area of chronic poor water quality.These underway surveys were completed during all four seasonal periods to see if these structures are present year round (Kincaid, 2001 a, b, c; Kincaid and Bergondo, 2005).
 Starting in 2004 – 2005, the NBC funded URI students D. Bergondo, J. Rogers and N. LaSota to expand our understanding of temporal flow dynamics in Narragansett Bay. Underway ADCP surveys provide remarkable spatial maps of water circulation, but only at limited times. Given this, the NBC once again worked within a multi-pronged, multi-agency effort to advance the NB-ROMS data set. The next step was to build from a RI Sea Grant-funded effort which deployed moored ADCPs that sit on the ocean bottom to image water flow at every meter of the water column for extended periods of time. Figure 2 summarizes the locations where Dr. Kincaid’s lab has collected moored ADCP data for periods of 3 months to approximately 1 year. To provide this level of temporal flow data in the Providence and Seekonk Rivers, NBC supported the deployment of moored ADCPs in strategic locations of the shipping channel near the mouth of the Providence River, south of Fields Point and at on the Edgewood Shoals (Kincaid and Bergondo, 2005). Four months of 6-minute flow data was collected at 50-centimeter depth increments throughout the water column, bringing prior underway ADCP maps to life. These surveys revealed how average and pulsating circulation of shallow (outbound) and deep (inbound) water currents within the shipping channel respond to factors like wind and runoff. These data show in fascinating detail how the Edgewood Shoals water-retaining gyre, first defined in the underway ADCP maps, pulses with these same environmental factors. It is important to note that every time a moored ADCP is deployed, underway ADCP data are collected at discrete times to gauge how representative moored data are of flow through the local cross-section.
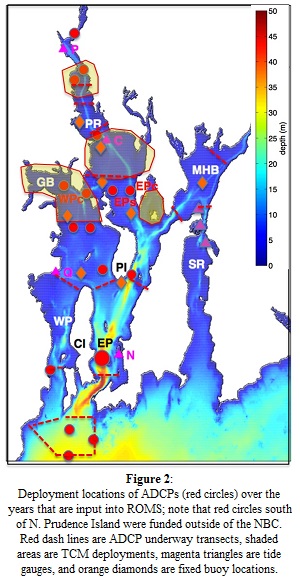
 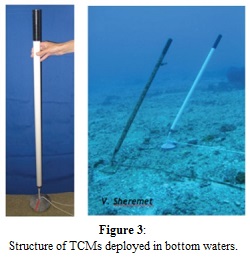 In 2010, NBC again capitalized on an opportunity to augment RI Sea Grant work to utilize a new low-cost RI-developed sensor technology called tilt current meters (TCMs; developed by URI scientist V. Sheremet) to capture more flow data throughout the Bay (Figure 3). TCMs are simply small buoyant sticks attached to a mooring by a flexible membrane. Data on tilt angle (large tilt = large flow rate) and tilt direction are converted to water velocity. TCMs provide a key advantage: time series data at multiple, distributed sites, for long periods of time. RI Sea Grant funded URI student C. Balt to deploy large numbers of TCMs (e.g., >20 per experiment) for 2- to 3-month periods in the two regions of the Bay with the most chronic low oxygen conditions: Greenwich Bay and the Edgewood Shoals region of the Providence River (Balt, 2014). Additional TCMs, sponsored by the NBC, were placed on Edgewood Shoals to enhance the spatial-temporal detail, particularly along the channel-shoal interface to resolve small-scale eddy structures. TCMs reveal in exquisite detail how the Edgewood Shoals gyre evolves given a wide range of tide, wind and runoff conditions, and provide an invaluable check point to gauge the accuracy of ROMS simulations in the most impacted regions of the estuary. Interestingly the TCMs on Edgewood Shoals were deployed over an optimal window for capturing the flow conditions before, during and after the historic March 2010 floods.
 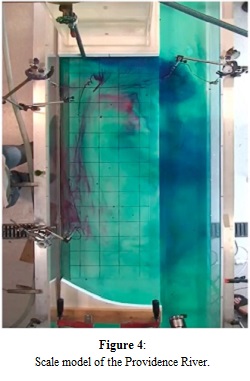 To further investigate the flow structures of the Providence River, Dr. Kincaid worked with world-renowned colleague Dr. Ross Griffiths at the Geophysical Fluid Dynamics (GFD) laboratory of the Australian National Lab to develop a scaled model of the Providence River channel and the Edgewood Shoals region (Figure 4; for more information on this click here). The simplified model includes scaled bathymetry features, tides, and river runoff. For a wide range in parameter choices, the scaled lab model replicated the primary features of flow in the channel and on the shoal that were observed in ADCP and TCM data. The scaled lab model also provided clues to how small-scale eddies along the channel-shoal interface feed the larger gyre flow.
 The NBC, along with many other organizations, also continue to support another important data set that is utilized in the NB-ROMS: the fixed-site water quality network. This network includes thirteen buoys that collect water quality data throughout the Bay for months at a time. Sensors collect data that are imperative to calibrating the NB-ROMS, such as depth, temperature, salinity, density, chlorophyll and dissolved oxygen levels. The data from the fixed-site stations maintained by the NBC are available here.
Calibration & Iterations of the Narragansett Bay ROMS
The NBC teamed with Dr. Kincaid and his students to develop and improve the NB-ROMS, incorporating the various water quality data collected over several years. Early models by D. Bergondo and J. Rogers focused on upper Bay and RI Sound-Narragansett Bay processes, shown in the black box and by the blue dots in Figure 5, respectively. The upper Bay ROMS included the Providence River south to the tip of Prudence Island (black box in Figure 5; Kincaid and Bergondo, 2005; Bergondo and Kincaid, 2007), employing grid boxes that were relatively large, or coarse.
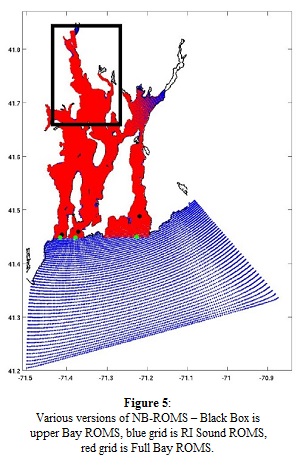 The size of the grid boxes is referred to as the grid resolution, which for this version of the model was 150 m. These models agreed well with tidal predictions and made a number of interesting predictions for flushing and chemical transport (Bergondo, 2004). While simulations predicted the flow of northern pollution sources to the south and the efficient flushing of the many sections of the Providence River, they did not capture other structures that were present in the ADCP data sets, such as the Edgewood Shoals gyre. Based on these results along with feedback provided by RI Department of Environmental Management and an external consultant hired by NBC, it was determined that more work was necessary to increase the grid resolution and spatial coverage on this version of the NB-ROMS. A key comment from the consultant was that the upper Bay ROMS used an open ocean boundary at North Prudence Island that was too close to the region of interest (ATM Inc., 2007). While NB-ROMS models existed that had an open ocean boundary all the way out in Rhode Island Sound (blue nodes in Figure 5; Rogers, 2008), the outside consultant agreed that these models also lacked the resolution to recreate hydrodynamic features of the upper Bay defined in field data and the scaled lab model. To resolve the issues of the previous versions, a new model grid, often referred to as the NBC-URI Full Bay ROMS (or simply the Full Bay ROMS), was developed that utilized a grid resolution <50 m in the Providence River, expanding to approximately 200 m grid resolution near an open ocean boundary at the mouth of Narragansett Bay (red colored grid in Figure 5). In addition to the horizontal grid resolution, the Full Bay ROMS divides the water column into 15 vertical layers.
 The question was: could this new higher resolution version of the Full Bay ROMS stand up to the extensive data sets and the lab results? 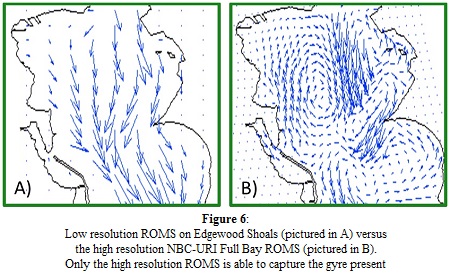 Figure 6 shows a comparison between how the low and high resolution (Full Bay ROMS) versions of NB-ROMS simulate flow on Edgewood Shoals. The former misses the Edgewood Shoals gyre, while the latter successfully captures the gyre’s circular counter-current. As this is only a snapshot comparison conducted as part of a study to map the dispersion of dye throughout the Bay (Kincaid, 2012), a number of statistical data-model comparisons were done to see how the Full Bay ROMS performed at representing other spatial and temporal aspects of circulation. Such a comparison for Edgewood Shoals during the 2010 March flood shows the Full Bay ROMS successfully captures the flow conditions before the flood. Perhaps more impressive is that the model captures the response of the system to one of the largest runoff events on record, and the return from this event to “normal” conditions. This is shown qualitatively and through statistical data-model skill factors (Kincaid, 2012).
Figure 6 shows a comparison between how the low and high resolution (Full Bay ROMS) versions of NB-ROMS simulate flow on Edgewood Shoals. The former misses the Edgewood Shoals gyre, while the latter successfully captures the gyre’s circular counter-current. As this is only a snapshot comparison conducted as part of a study to map the dispersion of dye throughout the Bay (Kincaid, 2012), a number of statistical data-model comparisons were done to see how the Full Bay ROMS performed at representing other spatial and temporal aspects of circulation. Such a comparison for Edgewood Shoals during the 2010 March flood shows the Full Bay ROMS successfully captures the flow conditions before the flood. Perhaps more impressive is that the model captures the response of the system to one of the largest runoff events on record, and the return from this event to “normal” conditions. This is shown qualitatively and through statistical data-model skill factors (Kincaid, 2012). NBC-URI Full Bay ROMS Hydrodynamic Results
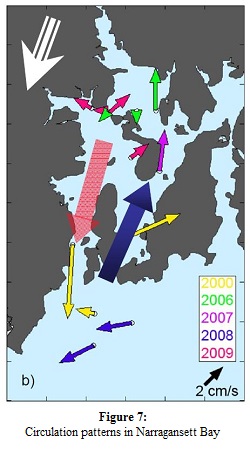 Through the extensive data collection efforts and the equations for simulating hydrodynamics in the Full Bay ROMS, much has been ascertained and confirmed about the flows within Narragansett Bay (Figure 7). These data have revealed how water moves northward on average through the East Passage and southward through the West Passage of Narragansett Bay (Kincaid et al., 2003; Kincaid et al., 2008), how water is circulated in RI Sound, just outside the mouth of the Bay (Kincaid et al., 2003; Wertman et al., 2015), and how water is exchanged between RI Sound and the Bay (Pfeiffer-Herbert et al., 2015). The speed and strength of this circulation pattern is affected by the wind direction, with northward winds slowing down the flow and southward winds speeding it up.
In the Providence River, the sub-tidal flow tends to move strongly out the western side of the shipping channel, while a deep sub-tidal inflow is located on the eastern side of the shipping channel (Kincaid, 2001 a, b, c). This creates a two-layer flow in the shipping channel (surface out and bottom in), which seems to be very stable.
In the shallower regions of the Providence River, adjacent to the shipping channel, there is weaker, often reversed flow of water in eddies and small gyres as described in ADCP and TCM data and the scaled lab model in Australia (Kincaid and Bergondo, 2005; Kincaid, 2012). The gyre on Edgewood Shoals is highly prominent, but smaller eddies also exist in several other shallow near-shore areas. As in the shipping channel, there is also a two-layer flow in the gyres. On Edgewood Shoals, the mid to lower section of the water column moves in the clockwise gyre flow, while the surface water tends to be influenced mainly by the prevailing winds. This two-layer flow can stratify the water column, having a negative effect on water quality. The Full Bay ROMS shows gyres can also decrease water quality through increased water retention times, which on Edgewood Shoals can be on the order of 7 to 10 days. The Full Bay ROMS also shows that the breakwall at the Pawtuxet River appears to direct nutrient-rich bottom water north onto Edgewood Shoals, which further intensifies water quality issues on the shoal. Field data to confirm this northward flow of Pawtuxet River water was collected in the summer of 2014 and is in process.
In addition to highlighting the circulation of the Bay, the Full Bay ROMS is able to test how changing different factors, such as wind and runoff, affects and controls the circulation patterns of Narragansett Bay. Currently, the Full Bay ROMS is established for the conditions experienced in 2010, using the local precipitation, wind and temperature, as well as river and wastewater treatment flow. In idealized runs, the wind and runoff conditions are changed from what actually happened in 2010. Results of the 2010 model runs show that specific runoff and wind conditions control the retention time in the Providence River, as well as how water is directed to the East and West Passages. Winds out of the northeast cause the Providence River to drain effectively and force the flow through the West Passage, while winds from the south, typical of what Rhode Island experiences during the summer months, holds water in the Providence River, increasing retention times on the Edgewood Shoal and directing water into the East Passage (Kincaid, 2012).
The encouraging successes of the Full Bay ROMS model have allowed Dr. Kincaid and his team to move forward with next stages of modeling biochemical transport in the Bay. Long-term biochemical transport and flushing processes are reliant on good representations of sub-tidal flows, or what remains after the sloshing effect of the twice-daily tides is averaged away. Sub-tidal flows are essential to estimating long-term pollution transport and water quality dynamics. This model’s ability to simulate sub-tidal flows in such a key region of the Providence River provides a good foundation for higher order transport and ecosystem modeling efforts.
Nutrient Tracking in the Bay
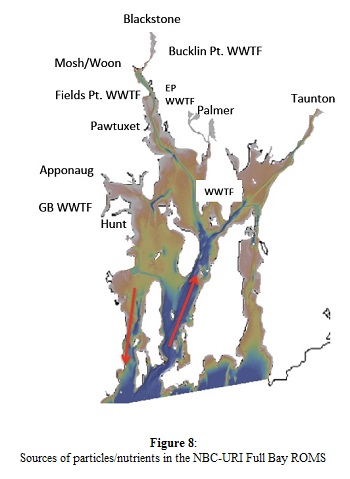 To further improve the NBC-URI Full Bay ROMS for management use, the NBC worked with Dr. Kincaid to incorporate the capability of introducing particles from different sources, which are then tracked as they travel throughout the Bay (Kincaid, 2012). In the Full Bay ROMS, the particles represent nitrogen. The nitrogen loading was tracked from 16 WWTFs and rivers, including the Blackstone, Moshassuck, Woonasquatucket, Pawtuxet, Apponaug, Hunt, Palmer, and Taunton Rivers, as well as the Bucklin Point, Field’s Point, East Providence, Greenwich Bay and Bristol WWTFs (Figure 8). The nutrient tracking inputs for the Blackstone River are more specialized than the other inputs, thanks to the Upper Blackstone Water Pollution Abatement District (UBWPAD), CDM Smith, and the University of Massachusetts – Amherst, who have collaborated to develop a water quality model for the Blackstone River. The UBWPAD model tracks nutrient concentrations for the UBWPAD WWTF and other point and non-point sources. These outputs are able to be utilized in the Full Bay ROMS. For the remaining nutrient inputs, monitoring data was employed to determine the nutrient loading. The goal of the nutrient tracking model runs was to address the following questions:
1) Do all nitrogen particles flush equally?
2) Do particles from southern sources exit the system more efficiently?
3) Which nitrogen particle sources contribute most to levels in the regions with chronic water quality problems?
4) What is the long-term effect of runoff pulses, either in spring or early summer?
5) What is the benefit of various nutrient reduction management strategies for lowering nitrogen levels in areas with chronic water quality problems?
To answer these questions, the Full Bay ROMS was run for the actual events of 2010, as well as for idealized runs where the winds and runoff conditions were changed. The model runs showed that all of the nitrogen particles do not flush equally. For example, the Blackstone River nitrogen particles spread out evenly over the Providence River, while the Field’s Point WWTF particles tend to become incorporated into the southerly flow on the western side of the shipping channel (Kincaid, 2012).
The nitrogen particle tracking work also showed that the southerly sources of nutrients do not always flush more efficiently. This is true for two cases, the Pawtuxet River and the Taunton River. The nitrogen particles present in the bottom water of the Pawtuxet River are carried north and become incorporated into the gyre that is present on Edgewood Shoals. This is important due to the long flushing times of the gyre and poor water quality of this area. For the Taunton River, the modeling suggests that significant amounts of water and associated nitrogen are carried north during southwestward winds. From winter to mid-summer, the Full Bay ROMS predicts that the Taunton River is an important source of nitrogen in the East Passage, Providence River, West Passage and even into Greenwich Bay (Kincaid, 2012).
Greenwich Bay is a region of Narragansett Bay with chronic water quality problems. In times of normal to low river flow (with no winds applied), the Blackstone and Pawtuxet Rivers and the Field’s Point WWTF (at 2010 nitrogen loading) together can contribute approximately 30% of the nitrogen in Greenwich Bay. During periods of high river flow and northwestward winds, the rivers can account for even more nitrogen inputs to this region (Kincaid, 2012).
 The long-term effect of runoff pulses, either in spring or early summer, were able to be studied extensively due to the 2010 March flood and the data collected during this time period. The Full Bay ROMS results show that, as a result of a spring flood, a 10% increase in nitrogen concentrations in the Field’s Point channel region, Edgewood Shoals and at the mouth of the Providence River may persist through early August. The model revealed that the longest influence of the storms was in Greenwich Bay, where the impact was seen to last for at least 40 days. Dr. Kincaid goes into further description of the effect of this event at other locations in the Bay in his 2012 report (Kincaid, 2012).
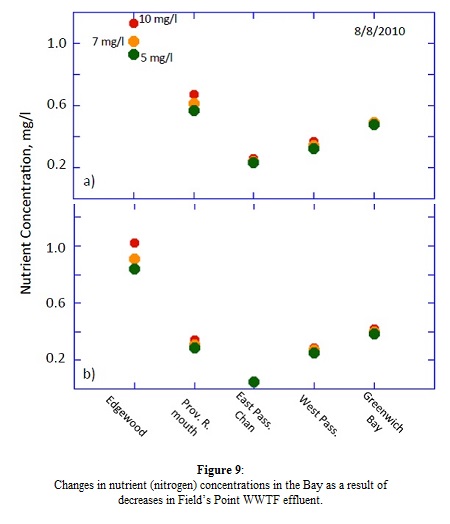
The Full Bay ROMS was utilized to determine possible benefits of various nutrient reduction management strategies for lowering levels in areas with chronic water quality problems. Dr. Kincaid executed model runs lowering the Field’s Point WWTF nitrogen output from 10 mg/L total nitrogen to the facility’s current permit limit of 5 mg/L. In Edgewood Shoals, there was a 10% decrease in the total nitrogen concentration with the Field’s Point WWTF effluent decrease (Figure 9). Further south in the Bay, including Greenwich Bay, this change was muted, if not indiscernible (Kincaid, 2012).
Ongoing Efforts
The NBC is continuing to develop the NBC-URI Full Bay ROMS with Dr. Kincaid. In future phases of the model, full hydrodynamic modeling of the Seekonk River will be included. In addition, the NBC is supporting the inclusion of a biological-oxygen model to the Full Bay ROMS. Model runs will be able to predict phytoplankton and dissolved oxygen concentrations as a result of changing nutrient inputs. In the future, the NBC has discussed the options of modeling scenarios of innovative engineering solutions to improve water quality conditions in upper Narragansett Bay. Examples of possible options include dredging a channel on Edgewood Shoals to increase flushing, removing the breakwall at the Pawtuxet River redirect nutrient rich flows south away from Edgewood Shoals, or even moving the NBC outfall at Field’s Point to Edgewood Shoals to see if flows from the treatment facility can break up the gyre.
The NBC-URI Full Bay ROMS is a powerful tool for resource managers and is already being used in a few different projects in Narragansett Bay. Full Bay ROMS is the basis of the Coastal Hypoxia Research Project of Narragansett Bay, funded by NOAA. The RIDEM is also using the Full Bay ROMS to investigate quahog larval transport within Narragansett Bay. The NBC sees the Full Bay ROMS as a valuable investment that can assist in management decisions to ensure that future expenditures result in realized improvements to water quality in the upper Bay.
References
Balt, C., 2014. Subestuarine circulation and dispersion in Narragansett Bay. University of Rhode Island, Ph.D. Dissertation, Kingston, RI, 322 pages.
Bergondo, D., 2004. Examining the processes controlling water column variability in Narragansett Bay: Time series data and numerical modeling Ph.D. dissertation, University of Rhode Island, Kingston, RI.
Kincaid, C. 2006. The Exchange of water through multiple entrances to the Mount Hope Bay estuary. Northeastern Naturalist, 13(SI4): 117-144.
Kincaid, C., D. Bergondo, and K. Rosenburger, 2008. Water exchange between Narragansett Bay and Rhode Island Sound, in Science for Ecosystem-based Management, edited by A. Desbonnet and B. A. Costa-Pierce, chap. 10, Springer, 2008.
Kincaid, C., R. Pockalny, and L. Huzzey, 2003. Spatial and temporal variability in flow at the mouth of Narragansett Bay, Journal Geophysical Research, 108.C7.
Kremer, J., J. Vaudrey, D. Ullman, D. Bergondo, N. LaSota, C. Kincaid, D. Codiga, and M. Brush. 2010. Simulating property exchange in estuarine ecosystem models at ecologically appropriate scales, Ecological Modelling 221.7: 1080-1088.
McManus, C., D. Ullman, S. Rutherford, and C. Kincaid. 2020. Northern quahog (Mercenaria mercenaria) larval transport and settlement modeled for a temperate estuary. Limnology and Oceanography 65.2: 289-303.
Pfeiffer-Herbert, A., C. Kincaid, D. Bergondo, and R. Pockalny, 2015. Dynamics of wind-driven estuarine-shelf exchange in the Narragansett Bay estuary, Continental Shelf Research, 105:42-59.
Rogers, J., 2008. Circulation and transport in upper Narragansett Bay, University of Rhode Island, Master Thesis, Kingston, RI, 107 pp.
Ullman, D., D. Codiga, A. Pfeiffer‐Herbert, and C. Kincaid. 2014. An anomalous near‐bottom cross‐shelf intrusion of slope water on the southern New England continental shelf. Journal of Geophysical Research: Oceans 119.3: 1739-1753.
Ullman, D., D. Codiga, A. Pfeiffer‐Herbert, and C. Kincaid. 2014. An anomalous near‐bottom cross‐shelf intrusion of slope water on the southern New England continental shelf. Journal of Geophysical Research: Oceans 119.3: 1739-1753.
Wertman, C., R. Yablonsky, Y. Shen, J. Merrill, C. Kincaid, and R. Pockalny, 2014. Mesoscale convective system surface pressure anomalies responsible for meteotsunamis along the U.S. East Coast on June 13th, 2013, Scientific Reports 4, 7143.