Week of November 5 – 11, 2023
Fixed Site Network
Phillipsdale Landing
Overall, water quality was good at Phillipsdale Landing this week. Sondes were swapped this week on the morning of November 7th. There were 0.18 inches of precipitation recorded at T.F. Green this week. Blackstone River flow was higher than normal for this time of year. Surface salinity averaged 5.9 ppt and ranged from 2.0 ppt to 19.3 ppt. Bottom salinity averaged 21.1 ppt and ranged from 4.6 ppt to 28.3 ppt. Temperatures decreased this week, averaging 10.6°C at the surface and ranging from 8.1°C to 12.6°C. At the bottom, temperatures averaged 13.5°C and ranged from 10.5°C to 15.3°C.
Dissolved oxygen (DO) at Phillipsdale Landing remained above the hypoxia threshold of 2.9 mg/L at both the surface and bottom all week. Surface DO remained similar to the previous week, averaging 9.8 mg/L and ranging from 7.2 to 10.8 mg/L. Bottom DO averaged 5.9 mg/L and ranged from 4.0 mg/L to 10.0 mg/L. Chlorophyll readings remained low, averaging 0.6 ug/L at the surface and 0.9 ug/L at the bottom. Maximum chlorophyll at the surface was only 1.0 ug/L. Please note that tidal fluctuations and Blackstone River flows greatly influence water column salinity, temperature, and DO at this location.
Bullock Reach
Overall, water quality was good at Bullock Reach this week. Salinity averaged 24.4 ppt, 27.5 ppt, and 29.7 ppt at the surface, middle, and bottom sondes, respectively. Surface salinity ranged 18.5 – 27.2 ppt, mid salinity ranged 24.0 – 29.9 ppt, and bottom salinity ranged 28.2 – 30.7 ppt. Surface temperatures averaged 12.8°C and ranged from 10.7°C to 14.1°C. Mid temperatures averaged 13.4°C and ranged from 12.3°C to 14.3°C. Bottom temperatures averaged 14.2°C and ranged from 13.3°C to 14.8°C.
DO concentrations at Bullock Reach remained above the hypoxia threshold all week. Surface DO averaged 7.8 mg/L and ranged 6.8 – 9.5 mg/L. In the mid waters, DO averaged 7.3 mg/L and ranged 6.3 – 8.0 mg/L. At the bottom, DO averaged 6.7 mg/L and ranged 5.6 – 7.3 mg/L. Chlorophyll concentrations were low, averaging 2.0 ug/L, 2.5 ug/L, and 2.1 ug/L at the surface, mid, and bottom waters, respectively. The maximum surface chlorophyll of 5.0 ug/L occurred during the afternoon on November 5th.
Week of October 29 – November 4, 2023
Fixed Site Network
Phillipsdale Landing
Overall, water quality was good at Phillipsdale Landing this week. There were 1.14 inches of precipitation recorded at T.F. Green this week, mostly from rain events on the 29th and 30th. Blackstone River flow was higher than normal for this time of year. Surface salinity averaged 8.7 ppt and ranged from 2.0 ppt to 21.8 ppt. Bottom salinity averaged 20.5 ppt and ranged from 6.1 ppt to 27.9 ppt. Temperatures decreased this week, averaging 13.0°C at the surface and ranging from 8.8°C to 16.5°C. At the bottom, temperatures averaged 15.0°C and ranged from 11.2°C to 16.7°C.
Dissolved oxygen (DO) at Phillipsdale Landing remained above the hypoxia threshold of 2.9 mg/L at both the surface and bottom. Surface DO remained similar to the previous week, averaging 8.7 mg/L and ranging from 5.6 to 11.1 mg/L. Bottom DO averaged 5.9 mg/L and ranged from 4.6 mg/L to 10.0 mg/L. Chlorophyll readings remained low, averaging 0.9 ug/L at the surface and 0.8 ug/L at the bottom. Maximum chlorophyll at the surface was only 3.5 ug/L, recorded on the morning of October 29th. . Please note that tidal fluctuations and Blackstone River flows greatly influence water column salinity, temperature, and DO at this location.
Bullock Reach
Sondes were swapped this week on the morning of October 31. Overall, water quality was good at Bullock Reach this week. Salinity averaged 23.9 ppt, 27.3 ppt, and 29.4 ppt at the surface, middle, and bottom sondes, respectively. Surface salinity ranged 20.4 – 27.5 ppt, mid salinity ranged 23.0 – 29.3 ppt, and bottom salinity ranged 27.8 – 30.4 ppt. Surface temperature averaged 14.3°C and ranged from 11.6°C to 17.0°C. Mid temperatures averaged 15.2°C and ranged from 13.6°C to 16.8°C. Bottom temperatures averaged 15.6°C and ranged from 13.9°C to 16.2°C.
DO concentrations at Bullock Reach remained above the hypoxia threshold all week. Surface DO averaged 7.3 mg/L and ranged 6.2 – 8.9 mg/L. In the mid waters, DO averaged 6.8 mg/L and ranged 5.8 – 9.5 mg/L. At the bottom, DO averaged 6.5 mg/L and ranged 5.9 – 7.2 mg/L. Chlorophyll concentrations were low, averaging 1.9 ug/L, 2.5 ug/L, and 1.6 ug/L at the surface, mid, and bottom waters, respectively. The maximum surface chlorophyll of 4.7 ug/L occurred during the afternoon on November 4th.
Week of October 15 - 21, 2023
Phytoplankton Sampling
Phytoplankton samples were collected on October 18, 2023 at Bullock’s Reach and analyzed in the laboratory shortly after collection. It was a cloudy and chilly day on Narragansett Bay. The water was noticeably clear to almost 5 meters depth. Sonde data revealed the surface water temperature was 15.8°C, salinity was
24.9 psu, and chlorophyll a was 7.85 ug/L. The qualitative tow net sample had a medium filter time, and the filtrate was a light brown color. Some comb jellyfish were detected in the sample.
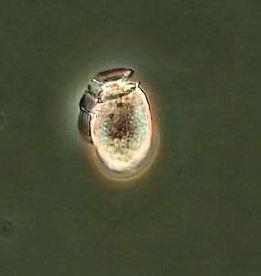
The analysis of the quantitative whole water sample revealed a total of 1,997,000 cells per Liter. The micro flagellates were found at 419,000 cells/L. The most predominant phytoplankton genus
was Skeletonema spp. at 1,255,000 cells/L. Other representative genera include Chaetoceros spp., Leptocylindrus spp., and Cerataulina spp. This week's featured image is the diatom Ditylum brightwellia, captured at 200x phase contrast.
Week of November 19 – 25, 2023
Bacteria Sampling
On November 21, 2023, 15 stations were sampled for fecal coliform bacteria in the Providence and Seekonk Rivers; 3 of these stations were also sampled for enterococci bacteria. There was a smaller set of locations sampled than normal due to cold weather conditions and time constraints. In the five days prior to sampling, precipitation totaled 0.15 inches as recorded at TF Green.
Overall, bacteria levels were lower in both the Seekonk and Providence Rivers this week than during the previous sampling event on October 25th. Fecal coliform levels similar in the Seekonk River and Providence River sites (geometric means of 22 MPN/100 mL and 23 MPN/100 mL, respectively). The maximum concentration (230 MPN/100 mL) was measured at Point St Bridge.
Enterococci results had an overall geometric mean of 19 MPN/100 mL and ranged from <10 MPN/100 mL at Phillipsdale Landing and South FP East to 134 MPN/100 mL at Point St. Bridge.
The table below lists the Rhode Island bacteria standards for primary contact and shellfishing established by the Rhode Island Department of Environmental Management (RIDEM). RIDEM defines primary contact as any recreational activities in which there is prolonged and intimate contact with water, involving considerable risk of ingesting water (e.g., swimming, diving, water skiing and surfing). Please note that the RIDEM bacteria standards are provided here for informational purposes only and are not intended to indicate official state compliance with primary contact or shellfishing standards.
Summary of Rhode Island Bacteria Standards for Saltwater Primary Contact and Shellfishing
| Fecal Coliform | Enterococci |
| Primary Contact1 | Geometric mean ≤50 MPN/100 mL
<10% of samples >400 MPN/100 mL
| Geometric mean ≤35 colonies/100 mL
All samples ≤104 colonies/100 mL2 |
| Shellfishing | Geometric mean ≤14 MPN/100 mL
<10% of samples >49 MPN/100 mL3 | NO ENTEROCOCCI CRITERIA
|
1Fecal coliform primary contact criteria applied only when adequate enterococci data are not available;
2Single sample maximum criterion for determining beach swimming advisories at designated beaches as evaluated by the Rhode Island Department of Health;
3For a three-tube decimal dilution
Week of October 22 - 28, 2023
Bacteria Sampling
On October 25th, twenty stations were sampled for fecal coliform bacteria in the Providence and Seekonk Rivers; five of these stations were also sampled for enterococci bacteria. In the five days prior to sampling, precipitation totaled 1.14 inches as recorded at TF Green. Overall, bacteria counts were higher in both the Seekonk and Providence Rivers this week than during the previous sampling event on October 11th. Fecal coliform counts were higher in the Seekonk River sites than in the Providence River sites (geometric means of 187 MPN/100 mL and 55 MPN/100 mL, respectively). The maximum count (930 MPN/100 mL) was measured at India Point Park.
Enterococci results had an overall geometric mean of 55 MPN/100 mL and ranged from 10 MPN/100 mL in one of the duplicate samples at Conimicut Point to 160 MPN/100 mL at South FP East.
The table below lists the Rhode Island bacteria standards for primary contact and shellfishing established by the Rhode Island Department of Environmental Management (RIDEM). RIDEM defines primary contact as any recreational activities in which there is prolonged and intimate contact with water, involving considerable risk of ingesting water (e.g., swimming, diving, water skiing and surfing). Please note that the RIDEM bacteria standards are provided here for informational purposes only and are not intended to indicate official state compliance with primary contact or shellfishing standards.
Summary of Rhode Island Bacteria Standards for Saltwater Primary Contact and Shellfishing
| Fecal Coliform | Enterococci |
| Primary Contact1 | Geometric mean ≤50 MPN/100 mL
<10% of samples >400 MPN/100 mL
| Geometric mean ≤35 colonies/100 mL
All samples ≤104 colonies/100 mL2 |
| Shellfishing | Geometric mean ≤14 MPN/100 mL
<10% of samples >49 MPN/100 mL3 | NO ENTEROCOCCI CRITERIA
|
1Fecal coliform primary contact criteria applied only when adequate enterococci data are not available;
2Single sample maximum criterion for determining beach swimming advisories at designated beaches as evaluated by the Rhode Island Department of Health;
3For a three-tube decimal dilution