Surface Mapping
Surface mapping is achieved through the collection of high-resolution water quality data in coordination with geographical positioning (location) data. The parameters collected are all very important to determining the overall water quality of the Bay. While the NBC’s vessel, the R/V Monitor, is underway on a specified transect (route) in the Bay, the location of the boat is recorded at a very high rate and saved to a computer, while simultaneously water is pumped from the surface of the Bay through a flow meter to a water quality sonde, where sensors capture various water quality parameters. Water quality sondes can be customized to measure various parameters, but the NBC sonde is set up to measure temperature, salinity, dissolved oxygen and chlorophyll a data. After the data is collected, it is entered into geographic information system (GIS) software. This software takes the location data and relates it with the corresponding water quality data, creating a map of the water quality parameter data. An example is shown below.
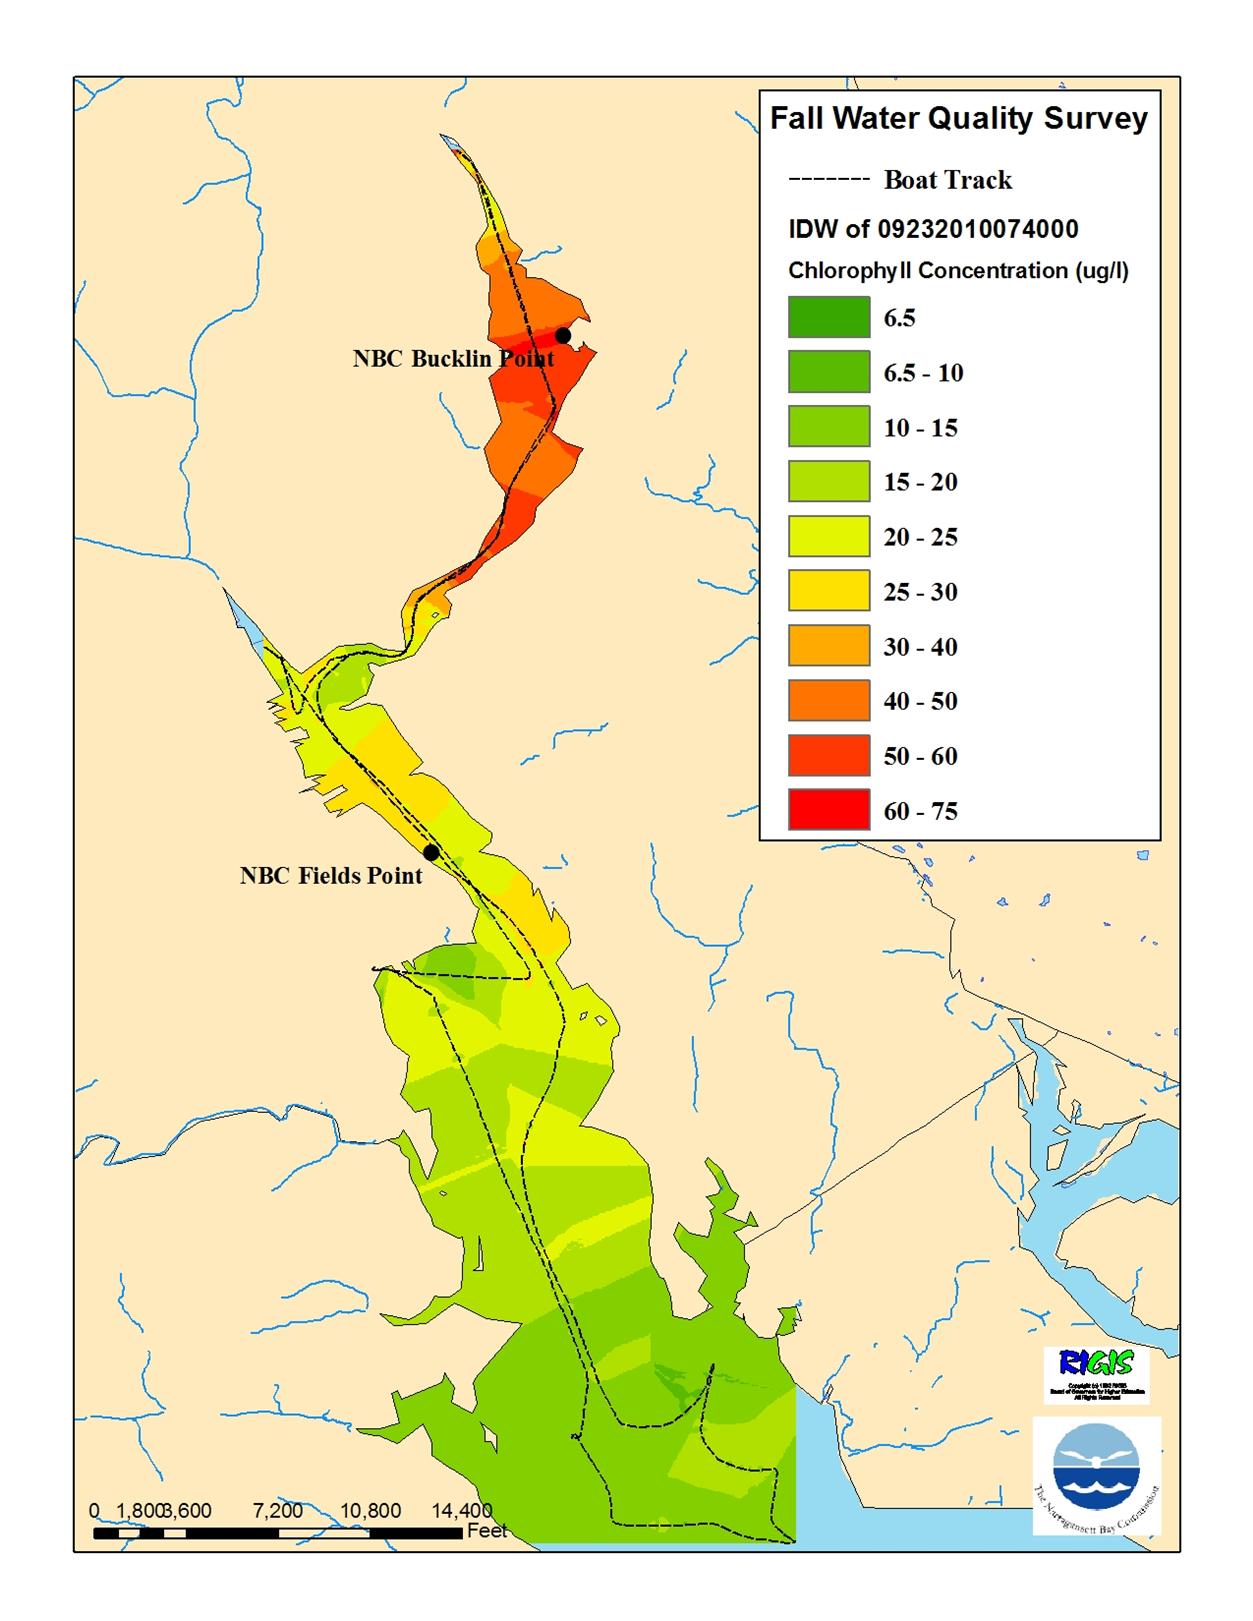
Map of the chlorophyll a concentrations in the upper Bay on September 23, 2010.
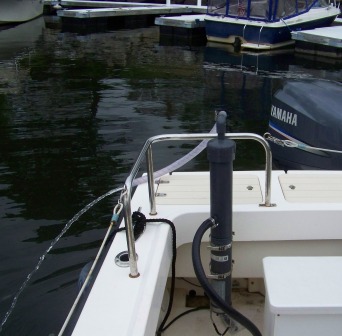
Picture showing the water quality sonde and tubes which run surface water .
This is a new monitoring initiative for the NBC and we expect to operate the system whenever the boat is underway performing other routine monitoing, typically each Wednesday. There is an ongoing effort to collaborate with the Narragansett Bay Research Reserve to expand the extent of the coverage to include areas south of Conimicut Point, including the shellfishing conditional areas and Greenwich Bay.