Week of December 22-28
Bacteria Sampling
Twenty stations were sampled for fecal coliform bacteria in the Providence and Seekonk Rivers on December 24, 2019. Five stations were also sampled for enterococci. There was no recorded precipitation in the five days prior to sampling.
The geometric mean of fecal coliform results for all sites was 19 MPN/100 mL, a slight increase compared to 12 MPN/100 mL during the previous sampling event on November 14. Counts were higher at the Seekonk River sites than the Providence River sites, with geometric means of 28 and 16 MPN/100 mL, respectively. The maximum count (230 MPN/100 mL) was measured at the Off FP Outfall site in the Providence River. Results for both the Providence River and the Seekonk River were within state standards for primary contact but exceeded standards for shellfishing.
The enterococci results decreased very slightly from the previous sampling event on November 14, from 13 MPN/100 mL to 12 MPN/100 mL. Enterococci results ranged from <10 MPN/100 mL at two sites (Gaspee Point and Conimicut Point) to 41 MPN/100mL at Point St. Bridge. These enterococci results were within state standards for primary contact.
Please note: the results of NBC's fecal coliform and enterococci monitoring are for informational/research purposes only and are not intended to suggest official state compliance with bathing and shellfishing standards.
Week of December 29, 2019 - January 2, 2020
Surface Mapping
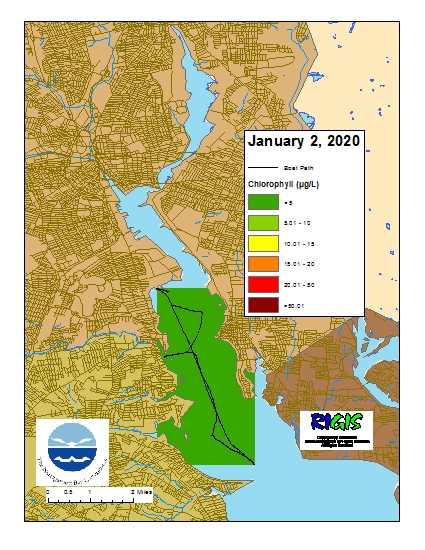
Data were collected on January 2, 2020 while the R/V Monitor was underway collecting nutrient samples in the Providence River estuary. The chlorophyll concentrations were good. From north to south, average chlorophyll concentrations were as follows: Upper Providence River (1.72 µg/L), Edgewood Shoals area (1.72 µg/L), Pawtuxet River area (2.39 µg/L), and Lower Providence River area (1.91 µg/L). Overall, chlorophyll ranged between non-detectable and 3.90 µg/L with an overall average of 1.95 µg/L. The chlorophyll data from this date are presented in the map below:

Week of December 22-28, 2019
Water Column Clarity
Water
clarity was measured at four locations in the Providence River on December 24,
2019. The three days prior to the
survey were dry, with no recorded rainfall.
The average Secchi depth reflected decreased clarity since the last
survey on December 4, from 3.2 m to 2.1 m.
Three sites exhibited decreased clarity since the last survey, with the
greatest decrease (down 1.20 m) observed at Edgewood Yacht Club. The remaining site (Point St. Bridge) had not
been surveyed recently. Water clarity ranged
from 1.4 m at India Point Park to 2.9 m at Bullock Reach. Overall, water
clarity in Upper Narragansett Bay increased from north to south.
Week of November 17 - 23, 2019
Nutrients Sampling
Nutrient samples were collected at seven local river stations and seven bay stations (surface and bottom) on November 20, 2019. The sampling day was preceded by approximately 0.25 inches of rainfall over the two days prior.
Among the river stations sampled, highest total nitrogen (TN), total dissolved nitrogen (TDN), and dissolved inorganic nitrogen (DIN) were observed in the sample from the Ten Mile River at Roger Williams Avenue, at 1,680 ppb, 1,760 ppb, and 1,440.6 ppb, respectively. The lowest TN (631 ppb) and TDN (345 ppb) results were observed at the Pawtuxet River at Broad Street, though results from the Moshassuck River at Higginson Avenue were similarly low (641 ppb and 360.5 ppb, respectively, average of duplicates). DIN results were also lowest at these two sites, with 206.2 ppb at the Pawtuxet River and 162.9 ppb (average of duplicates) at the Moshassuck River.
Among the bay stations sampled, the greatest TN (1,055 ppb) and DIN (774.5 ppb) in surface waters occurred at Pawtuxet Cove (average of duplicates); the highest TDN (912 ppb) occurred at Phillipsdale Landing. The lowest surface TN (468 ppb), TDN (217 ppb), and DIN (198.8 ppb) occurred at India Point Park.
Results from sampling on December 4 and 18 are pending analysis. The next scheduled date of sampling is January 2, 2020.
Week of November 3 - 9, 2019
Nutrients Sampling
Nutrient samples were collected at fourteen local and border river stations and eight bay stations on November 6, 2019; most bay stations were sampled at the surface only, with Edgewood Shoal sampled at the surface and bottom. The sampling day was preceded by approximately half an inch of rainfall on the day before.
Among the river stations sampled, highest total nitrogen (TN), total dissolved nitrogen (TDN), and dissolved inorganic nitrogen (DIN) were observed in the sample from the Ten Mile River at Central Avenue site, at 1,880 ppb, 1,960 ppb, and 1,617.9 ppb, respectively. The lowest TN and TDN values occurred in the samples from the Moshassuck River at Higginson Avenue, with results of 433 ppb and 459 ppb; the lowest DIN results were from Coles River at Milford Road, at 78.6 ppb (average of duplicates).
Among the bay stations sampled, the greatest TN (1,170 ppb), TDN (1,010 ppb), and DIN (773 ppb) in surface waters occurred at Phillipsdale Landing. The lowest surface TN (605 ppb), TDN (290 ppb), and DIN (244.5 ppb) occurred at Edgewood Shoal (average of duplicates).
Results from sampling on November 20 and December 4 and 18 are pending analysis. The next scheduled date of sampling is January 2, 2020.


