Historical News
R/V Monitor's Blog
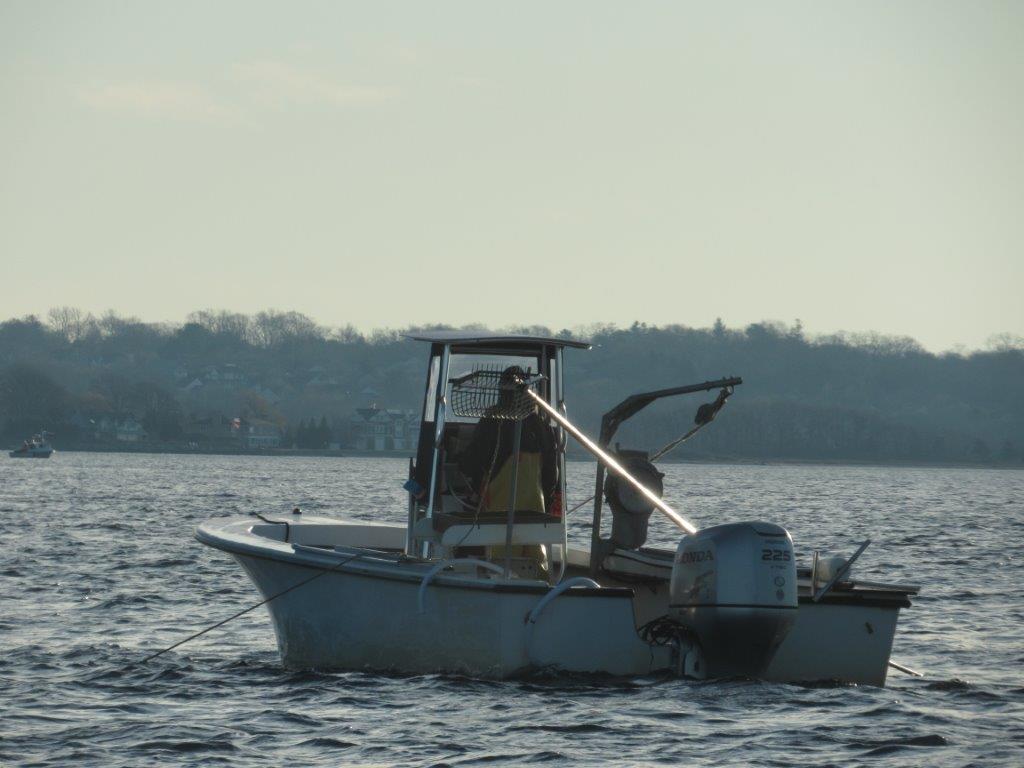
On Wednesday, February 12th, the crew of the R/V Monitor was out on the upper Bay collecting nutrients and plankton samples, taking Secchi Disk water clarity measurements, and conducting real-time surface mapping of water quality parameters, including dissolved oxygen, chlorophyll, water temperature, salinity, and pH, all in an effort to document water quality improvements associated with NBC construction projects. Jeff captained the boat while monitoring professionals Bekki and Gerard collected the samples and data. It was a partly sunny and brisk day, with a moderate breeze from the north-northwest which gradually subsided as the day progressed. The water was choppy in the morning, but became much calmer as the wind diminished. Today's photo features a shellfisherman observed out on the upper Bay.
Surface Mapping
Data were collected on February 12, 2020 while the R/V Monitor was underway collecting nutrient samples in the Providence River estuary. The chlorophyll concentrations were good. From north to south, average chlorophyll concentrations were as follows: Upper Providence River (1.31 µg/L), Edgewood Shoals area (1.19 µg/L), Pawtuxet River area (1.15 µg/L), and Lower Providence River area (1.35 µg/L). Overall, chlorophyll ranged between non-detectable and 10.20 µg/L with an overall average of 1.29 µg/L. The chlorophyll data from this date are presented in the map below: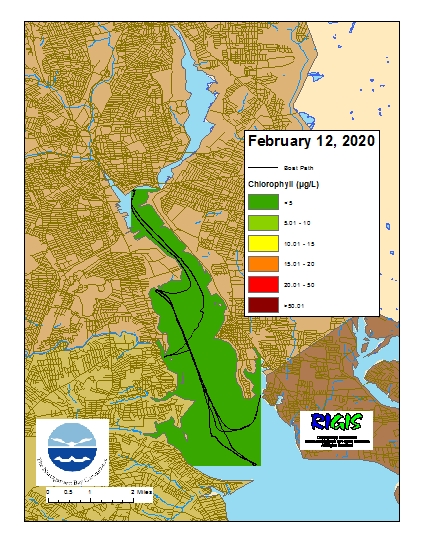
Surface Mapping
Data were collected on February 5, 2020 while the R/V Monitor was underway collecting bacteria samples in the Seekonk and Providence River estuaries. The chlorophyll concentrations were good. From north to south, average chlorophyll concentrations were as follows: Seekonk River (1.46 µg/L), Upper Providence River (1.12 µg/L), Edgewood Shoals area (1.67 µg/L), Pawtuxet River area (0.97 µg/L), and Lower Providence River area (1.53 µg/L). Overall, chlorophyll ranged between non-detectable and 3.60 µg/L with an overall average of 1.36 µg/L. The chlorophyll data from this date are presented in the map below: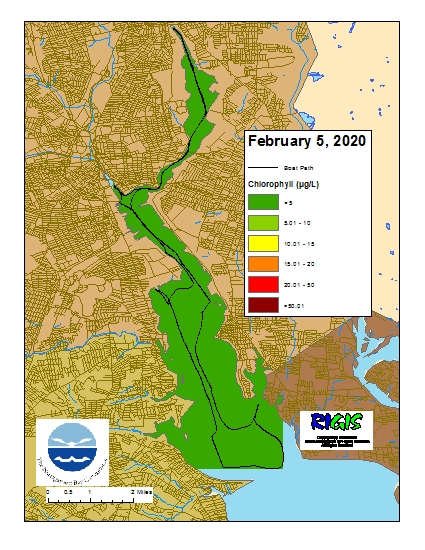
R/V Monitor's Blog
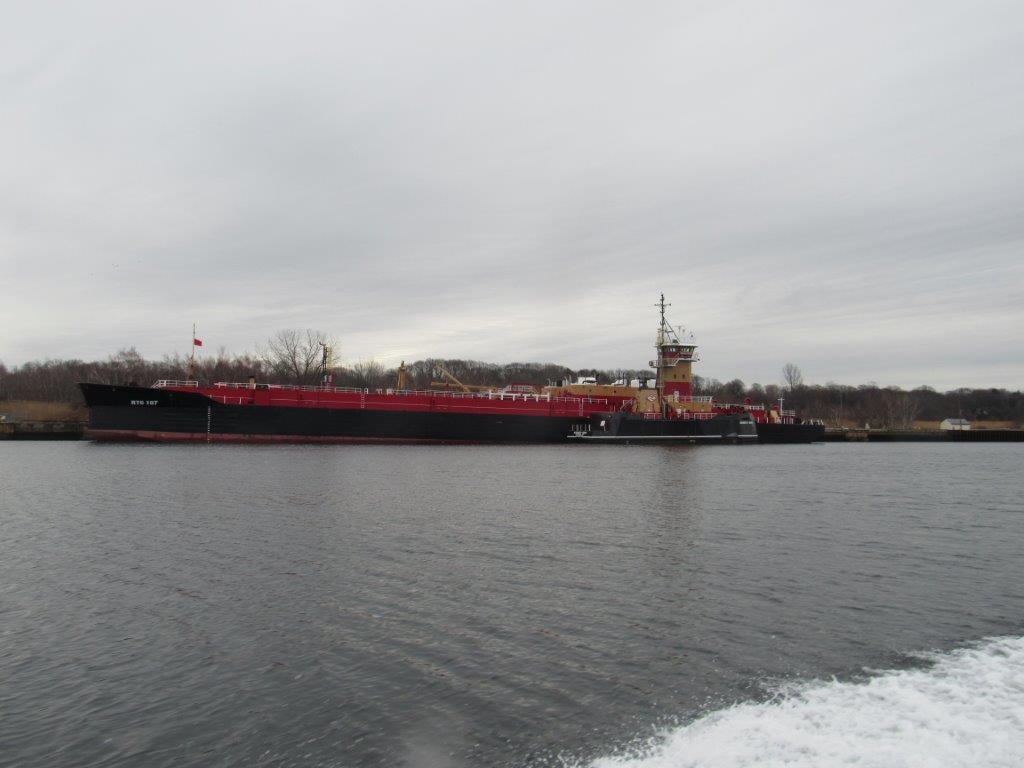
On Wednesday, February 5th, the crew of the R/V Monitor was out on the upper Bay collecting bacteria samples, taking Secchi Disk water clarity measurements, and conducting real-time surface mapping of water quality parameters, including dissolved oxygen, chlorophyll, water temperature, salinity, and pH, all in an effort to document water quality improvements associated with NBC construction projects. Jeff captained the boat while monitoring professionals Sara and Amanda collected the samples and data. It was a brisk, cloudy day with no wind and calm waters. The photo taken this day features a tanker moored at the East Providence terminal.
Nutrients Sampling
Nutrient samples were collected at seven local river stations and one bay station (Phillipsdale Landing; surface and bottom) on December 18, 2019. The remaining bay sampling by boat was canceled due to adverse weather conditions. In the five days prior to sampling, approximately 2.5 inches of total precipitation was recorded.
Among the river stations sampled, the highest total nitrogen (TN) and total dissolved nitrogen (TDN) were observed in the sample from the Ten Mile River at Roger Williams Avenue, with 1,310 ppb, and 1,490 ppb, respectively. The highest dissolved inorganic nitrogen (DIN) was observed in the sample from Pawtuxet River at Broad Street, with 1,139 ppb. The lowest TN (545 ppb), TDN (616 ppb), and DIN (370 ppb) results were observed at the Woonasquatucket River at Manton Avenue Bridge.
The surface waters at Phillipsdale Landing had results of 999 ppb TN, 1,090 ppb TDN, and 752 ppb DIN; chlorophyll a concentration measured 0.61 ug/L.
Results from nutrients sampling on January 2, 15, and 29 are pending analysis. The next scheduled date of sampling is February 12, 2020.
