Week of October 13 - 19, 2019
Fixed Site Network
Phillipsdale Landing
Water quality was good to fair this week at Phillipsdale Landing. The sondes were changed for routine maintenance on the morning of October 16. Approximately 1.8 inches of precipitation occurred over the course of the week, nearly all on October 16 and 17. This rain and subsequent increases in freshwater river flow contributed to declines in salinities mid-week. Surface salinity averaged 16.5 ppt, and ranged from 2 ppt to 28 ppt. Some of this week’s bottom salinity data were deemed suspect by NBC scientists. These data appeared anomalously low, believed to be due to bottom debris and snails that were observed in the cage around the sensors when the sonde was retrieved on October 16. The remaining data (October 16 late morning – October 19) averaged 20.5 ppt for bottom salinity, ranging 3 – 31 ppt. Water temperatures cooled slightly this week, averaging 15.4°C at the surface and 16.0°C at the bottom overall. Hypoxic conditions (dissolved oxygen [DO] <2.9 mg/L) were observed in the bottom waters briefly on October 16 (30 min maximum duration), where DO concentrations hit a minimum of 1.4 mg/L. Surface DO remained above the hypoxia threshold all week, averaging 7.8 mg/L with a minimum of 5.8 mg/L. Surface chlorophyll-a was low for most of the week, with an overall average of 5.1 ug/L and a maximum of 19.4 ug/L. Note that tidal fluctuations and Blackstone River flow greatly influence water column DO, temperature, and salinity at this location.
Bullock Reach
Bullock Reach data for late October are in review by NBC Scientists – at this time the only data available are partial for this week, ending mid-day on October 19. Additional data will be posted and discussed as they are reviewed.
Good water quality was observed this week at Bullock Reach. Water temperatures continue to cool, averaging 15.7°C at the surface and mid depths and 15.4°C at the bottom. Surface salinity averaged 28.3 ppt, ranging from 24 ppt to 30 ppt. Salinity values at the mid and bottom sondes averaged 29.9 ppt and 31.9 ppt, respectively. Salinity at all depths decreased over the course of the week; this was most pronounced for the surface waters, most impacted by the mid-week rainfall. There were no recorded measurements of hypoxia (DO <2.9 mg/L) at any depths. For the week overall, surface DO averaged 8.0 mg/L with a minimum of 7.3 mg/L, mid averaged 7.7 mg/L with a minimum of 7.3 mg/L, and bottom averaged 7.5 mg/L with a minimum of 6.8 mg/L. Chlorophyll at all depths remained low this week, averaging 3.4 ug/L at the surface, 2.7 ug/L at the mid, and 3.5 ug/L at the bottom.
Week of October 27 - November 2, 2019
Bacteria Sampling
Eleven stations were sampled for fecal coliform bacteria and three stations were sampled for enterococci in the Providence River on October 30, 2019. Bacteria samples were not collected in the Seekonk River due to the presence of thick fog. Three days prior to sampling, 1.4 inches of rainfall occurred.
The geometric mean of the eleven stations sampled for fecal coliform in the Providence River was 76 MPN/100 mL; the highest result occurred at Bullock Reach Buoy, with a reading of 230 MPN/100 mL. Providence River fecal coliform results exceeded standards for primary contact and shellfishing.
Enterococci results ranged from 10 MPN/100 mL at Conimicut Point to 108 MPN/100 mL at Gaspee Point, with an overall geometric mean of 31 MPN/100 mL. The Providence River enterococci geometric mean was less than the primary contact geometric mean criterion of 35 MPN/100 mL, however, the single sample maximum criterion of 104 MPN was exceeded.
Please note: the results of NBC's fecal coliform and enterococci monitoring are for informational/research purposes only and are not intended to suggest official state compliance with bathing or shellfishing standards.
Week of October 6 - 12, 2019
Fixed Site Network
Phillipsdale Landing
Water quality was good to fair this week at Phillipsdale Landing. Approximately 1.3 inches of precipitation occurred over the course of the week, with meaningful rainfall occurring on October 7 (0.2 inches), October 9 (0.97 inches), and October 10 (0.1 inches); salinity decreased in response to the rainfall and subsequent increases in freshwater river flow. Surface salinity averaged 20.6 ppt, and ranged from 10 ppt to 25 ppt. Most of this week’s bottom salinity data were deemed suspect by NBC scientists. These data appeared anomalously low, believed to be due to bottom debris and snails that were observed in the cage around the sensors when the sonde was retrieved on October 16. The remaining data (October 6 only) averaged 25.8 ppt for bottom salinity, ranging 15 – 28 ppt. Water temperatures continued to cool this week, averaging 16.7°C at the surface and 17.5°C at the bottom overall. Hypoxic conditions (dissolved oxygen [DO] <2.9 mg/L) were observed in the bottom waters briefly on October 6 (30 min maximum duration), where DO concentrations hit a minimum of 2.66 mg/L. A solitary low reading on October 12 (2.59 mg/L) is a suspected outlier; DO readings both before and after are above 6.5 mg/L. Surface DO remained above the hypoxia threshold all week, averaging 7.1 mg/L with a minimum of 4.0 mg/L. Surface chlorophyll-a was low for most of the week, with an overall average of 6.8 ug/L and a maximum of 17.3 ug/L. Note that tidal fluctuations and Blackstone River flow greatly influence water column DO, temperature, and salinity at this location.
Bullock Reach
Good water quality was observed this week at Bullock Reach. The sondes were changed for routine maintenance mid-day on October 8. As with Phillipsdale, water temperatures continue to cool, averaging 17.1°C at the surface and mid depths and 17.2°C at the bottom. Surface salinity averaged 28.7 ppt, ranging from 26 ppt to 30 ppt. Salinity values at the mid and bottom sondes averaged 29.3 ppt and 30.9 ppt, respectively. Salinity at the bottom increased slightly over the course of the week, while surface and mid waters decreased. There were no recorded measurements of hypoxia (DO <2.9 mg/L) at any depths. For the week overall, surface DO averaged 7.4 mg/L with a minimum of 6.5 mg/L, mid averaged 7.3 mg/L with a minimum of 6.3 mg/L, and bottom averaged 7.0 mg/L with a minimum of 5.8 mg/L. Chlorophyll at all depths remained low this week, averaging 3.2 ug/L at the surface, 3.4 ug/L at the mid, and 3.9 ug/L at the bottom.
Week of October 27 - November 2, 2019
R/V Monitor's Blog
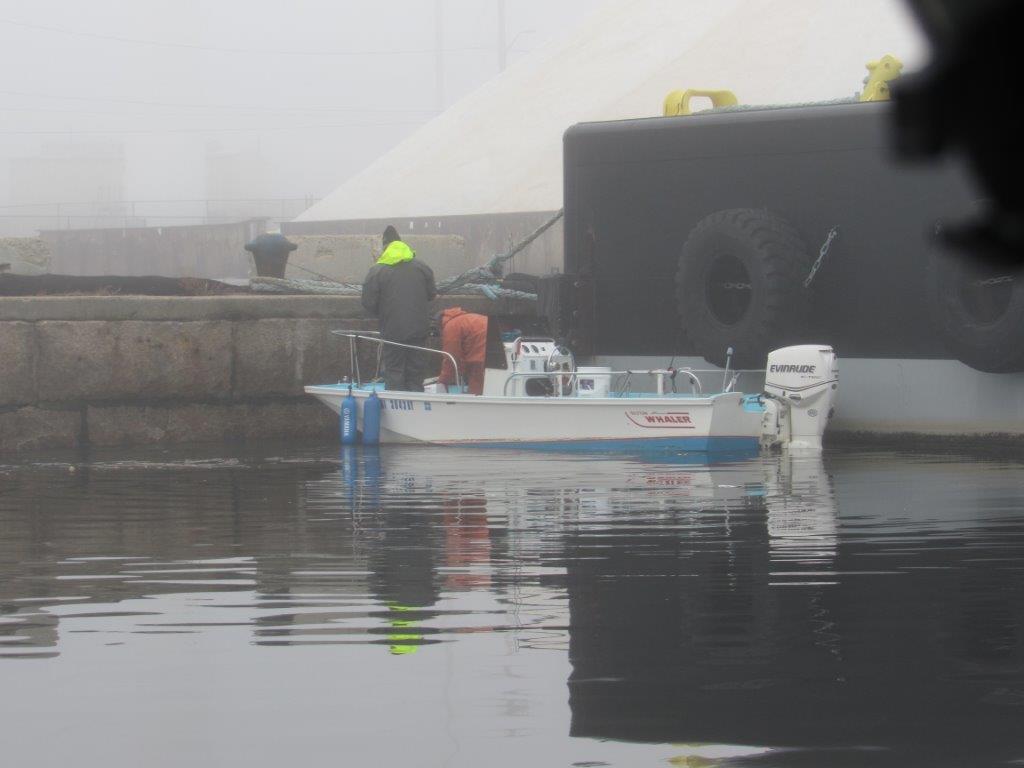
On Wednesday, October 30th, the crew of the R/V Monitor was out on the upper bay collecting bacteria samples, conducting water column profiles using the Seabird instrument, and conducting real-time surface mapping of water quality parameters, including dissolved oxygen, chlorophyll, water temperature, salinity, and pH, all in an effort to document quality improvements associated with NBC construction projects. Jeff captained the boat while monitoring professionals Sara, and Gerard collected the samples and data. The day started cloudy with no wind or waves. The visibility worsened as the morning progressed as a reult of heavy fog rolling in and further monitoring was called off due to safety concerns. The photo featured from this day shows a small vessel at Field's Point.
Week of October 27 – November 2, 2019
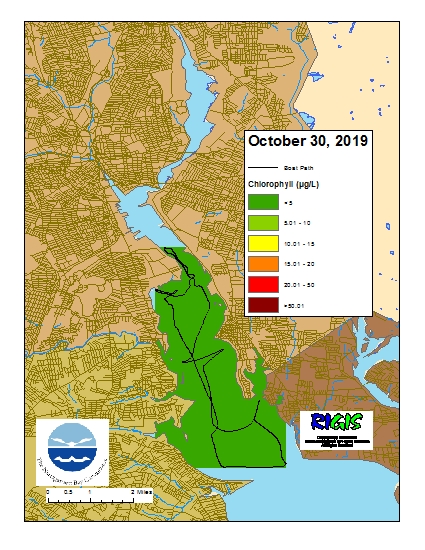
Surface Mapping
Data were collected on October 30, 2019 while the R/V Monitor was underway collecting bacteria samples in the Providence River estuary. The chlorophyll concentrations were good. From north to south, average chlorophyll concentrations were as follows: Upper Providence River (2.70 µg/L), Edgewood Shoals area (2.26 µg/L), Pawtuxet River area (2.48 µg/L), and Lower Providence River area (2.80 µg/L). Overall, chlorophyll ranged between 0.00 and 4.80 µg/L with an overall average of 2.61 µg/L. The chlorophyll data from this date are presented in the map below: