Historical News
Surface Mapping
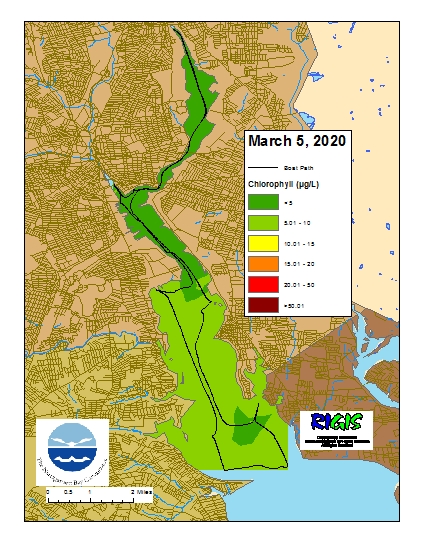
Data were collected on March 5, 2020 while the R/V Monitor was underway collecting bacteria samples in the Seekonk and Providence River estuaries. The chlorophyll concentrations were good to fair in areas surveyed. From north to south, average chlorophyll concentrations were as follows: Seekonk River (2.70 µg/L), Upper Providence River (4.14 µg/L), Edgewood Shoals area (7.58 µg/L), Pawtuxet River area (6.65 µg/L), and Lower Providence River area (6.29 µg/L). Overall, chlorophyll ranged between 1.20 and 9.80 µg/L with an overall average of 4.59 µg/L. The chlorophyll data from this date are presented in the map below:
Fixed Site Network
Phillipsdale Landing
Water quality was good this week at Phillipsdale Landing. Approximately 0.94 inches of precipitation was recorded over the week, with a majority (0.85 inches) occurring on February 27th. Following the rain on February 27th, Blackstone River flows increased, and surface salinity decreased in response. Overall, surface salinity averaged 6.6 ppt and ranged from 1.1 ppt to 17.1 ppt. Bottom salinity averaged 19.1 ppt and ranged from 1.9 ppt to 28.6 ppt. Compared to last week, both surface and bottom water temperatures increased this week; surface water temperatures averaged 5.4°C and ranged from 2.4°C to 7.3°C, while bottom waters averaged 5.2°C and ranged from 3.6°C to 7.0°C.
Dissolved oxygen (DO) concentrations remained well above the hypoxia threshold (>2.9 mg/L) at both depths. Surface DO averaged 12.5 mg/L, with a minimum of 11.7 mg/L and bottom DO averaged 11.7 mg/L, with a minimum of 10.0 mg/L. Surface chlorophyll-a increased since last week, averaging 5.1 ug/L with a maximum of 19.3 ug/L.
Bullocks Reach
The Bullock Reach sondes were removed for the season on November 19.
Fixed Site Network
Phillipsdale Landing
Water quality was good this week at Phillipsdale Landing. The sondes were changed-out for routine maintenance mid-morning on February 19th.
The only precipitation this week was 0.09 inches of rainfall occurring on February 18th. Blackstone River flows declined towards the end of the week and surface salinity increased in response. Overall, surface salinity averaged 5.6 ppt and ranged from 1.6 ppt to 14.3 ppt. Bottom salinity averaged 19.2 ppt and ranged from 3.3 ppt to 30.2 ppt. Both surface and bottom water temperatures remained cold this week; surface waters averaged 3.5°C and ranged from 1.1°C to 6.8°C, while bottom waters averaged 4.1°C and ranged from 2.1°C to 5.0°C.
Dissolved oxygen (DO) concentrations remained above the hypoxia threshold (>2.9 mg/L) at both depths. Surface DO averaged 13.0 mg/L, with a minimum of 11.8 mg/L and bottom DO averaged 11.2 mg/L, with a minimum of 9.8 mg/L. Surface chlorophyll-a remained low this week, averaging 2.2 ug/L with a maximum of 10.1 ug/L.
Bullocks Reach
The Bullock Reach sondes were removed for the season on November 19.
Nutrients Sampling
Nutrient samples were collected at seven river stations and in surface waters of six bay stations on January 29, 2019. Four days prior to sampling, 0.42 inches of rainfall was recorded.
Among the river stations sampled, highest nitrogen concentrations occurred at Ten Mile River at Roger Williams Avenue. At this site, concentrations of total nitrogen (TN), total dissolved nitrogen (TDN), and dissolved inorganic nitrogen (DIN) were over 2,000 ppb, at 2,710 ppb, 2,720 ppb, and 2,376 ppb, respectively. Lowest nitrogen concentrations were measured at the Moshassuck River at Higginson Avenue site, where TN was 666 ppb, TDN was 665 ppb, and DIN was 502 ppb.
Among the bay stations sampled, greatest TN (1,250 ppb), TDN (1,210 ppb), and DIN (903 ppb) in surface waters occurred at Phillipsdale Landing, the northernmost bay site sampled. The southernmost bay station, Conimicut Point, had the lowest nitrogen concentrations, with values of 522 ppb TN, 162 ppb TDN, and 246 ppb DIN. Nitrogen concentrations at Pomham Rocks were similar to those observed at Conimicut Point, with TN, TDN, and DIN concentrations of 555 ppb, 166 ppb, and 262 ppb, respectively.
Results from sampling on February 12 and February 27 are pending analysis. The next scheduled date of sampling is March 11.
Bacteria Sampling

