Week of October 6 - 12, 2019
Fixed Site Network
Phillipsdale Landing
Water quality was good to fair this week at Phillipsdale Landing. Approximately 1.3 inches of precipitation occurred over the course of the week, with meaningful rainfall occurring on October 7 (0.2 inches), October 9 (0.97 inches), and October 10 (0.1 inches); salinity decreased in response to the rainfall and subsequent increases in freshwater river flow. Surface salinity averaged 20.6 ppt, and ranged from 10 ppt to 25 ppt. Most of this week’s bottom salinity data were deemed suspect by NBC scientists. These data appeared anomalously low, believed to be due to bottom debris and snails that were observed in the cage around the sensors when the sonde was retrieved on October 16. The remaining data (October 6 only) averaged 25.8 ppt for bottom salinity, ranging 15 – 28 ppt. Water temperatures continued to cool this week, averaging 16.7°C at the surface and 17.5°C at the bottom overall. Hypoxic conditions (dissolved oxygen [DO] <2.9 mg/L) were observed in the bottom waters briefly on October 6 (30 min maximum duration), where DO concentrations hit a minimum of 2.66 mg/L. A solitary low reading on October 12 (2.59 mg/L) is a suspected outlier; DO readings both before and after are above 6.5 mg/L. Surface DO remained above the hypoxia threshold all week, averaging 7.1 mg/L with a minimum of 4.0 mg/L. Surface chlorophyll-a was low for most of the week, with an overall average of 6.8 ug/L and a maximum of 17.3 ug/L. Note that tidal fluctuations and Blackstone River flow greatly influence water column DO, temperature, and salinity at this location.
Bullock Reach
Good water quality was observed this week at Bullock Reach. The sondes were changed for routine maintenance mid-day on October 8. As with Phillipsdale, water temperatures continue to cool, averaging 17.1°C at the surface and mid depths and 17.2°C at the bottom. Surface salinity averaged 28.7 ppt, ranging from 26 ppt to 30 ppt. Salinity values at the mid and bottom sondes averaged 29.3 ppt and 30.9 ppt, respectively. Salinity at the bottom increased slightly over the course of the week, while surface and mid waters decreased. There were no recorded measurements of hypoxia (DO <2.9 mg/L) at any depths. For the week overall, surface DO averaged 7.4 mg/L with a minimum of 6.5 mg/L, mid averaged 7.3 mg/L with a minimum of 6.3 mg/L, and bottom averaged 7.0 mg/L with a minimum of 5.8 mg/L. Chlorophyll at all depths remained low this week, averaging 3.2 ug/L at the surface, 3.4 ug/L at the mid, and 3.9 ug/L at the bottom.
Week of October 27 - November 2, 2019
R/V Monitor's Blog
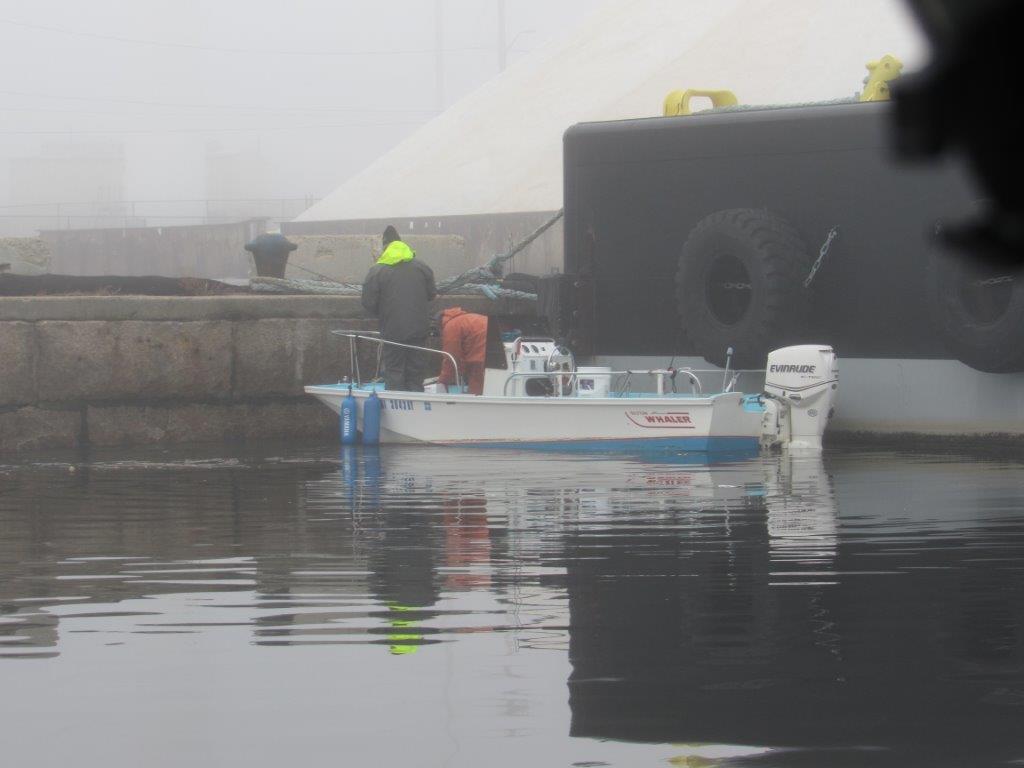
On Wednesday, October 30th, the crew of the R/V Monitor was out on the upper bay collecting bacteria samples, conducting water column profiles using the Seabird instrument, and conducting real-time surface mapping of water quality parameters, including dissolved oxygen, chlorophyll, water temperature, salinity, and pH, all in an effort to document quality improvements associated with NBC construction projects. Jeff captained the boat while monitoring professionals Sara, and Gerard collected the samples and data. The day started cloudy with no wind or waves. The visibility worsened as the morning progressed as a reult of heavy fog rolling in and further monitoring was called off due to safety concerns. The photo featured from this day shows a small vessel at Field's Point.
Week of October 27 – November 2, 2019
Surface Mapping
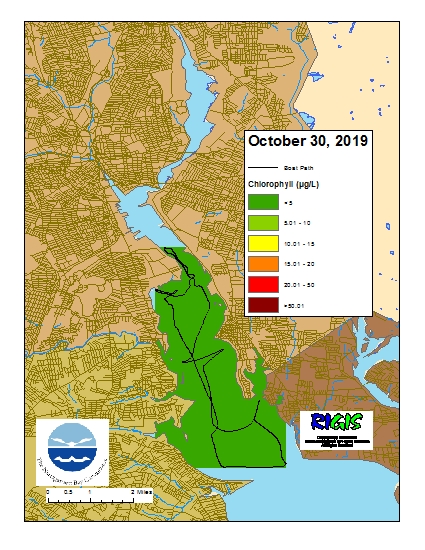
Data were collected on October 30, 2019 while the R/V Monitor was underway collecting bacteria samples in the Providence River estuary. The chlorophyll concentrations were good. From north to south, average chlorophyll concentrations were as follows: Upper Providence River (2.70 µg/L), Edgewood Shoals area (2.26 µg/L), Pawtuxet River area (2.48 µg/L), and Lower Providence River area (2.80 µg/L). Overall, chlorophyll ranged between 0.00 and 4.80 µg/L with an overall average of 2.61 µg/L. The chlorophyll data from this date are presented in the map below:
Week of September 29 - October 5, 2019
Fixed Site Network
Phillipsdale Landing
Water quality was good this week at Phillipsdale Landing. The sondes were changed for routine maintenance during the morning of October 1. Approximately 0.2 inches of precipitation occurred over October 1 – 4. Surface salinity averaged 21.5 ppt, and ranged from 13.2 ppt to 26.8 ppt, a slight increase from the previous week. Bottom salinity averaged 25.1 ppt, ranging 19.2 ppt – 28.9 ppt. Water temperatures cooled as the week progressed, averaging 19.6°C at the surface and 20.2°C at the bottom overall. Hypoxic conditions (dissolved oxygen [DO] <2.9 mg/L) were not observed in surface or bottom waters this week. Surface DO averaged 6.1 mg/L; minimum DO was 3.9 mg/L. Bottom DO was slightly improved over last week, averaging 4.9 mg/L and ranging from 3.0 mg/L to 8.9 mg/L. Chlorophyll-a was above 25 ug/L (during low tides) for most of the week, declining to less than 10 ug/L from Thursday through Saturday. These data suggest a decrease in phytoplankton activity from the previous week; the overall average chlorophyll was 18.5 ug/L. Note that tidal fluctuations and Blackstone River flow greatly influence water column DO, temperature, and salinity at this location.
Bullock Reach
Good water quality was observed this week at Bullock Reach. Water temperatures were slightly cooler than last week, averaging 19.7°C at all depths. Surface salinity averaged 28.6 ppt, ranging from 26.8 ppt to 30.0 ppt. Salinity values at the mid sonde and bottom sondes averaged 29.5 ppt and 30.0 ppt, respectively. Salinity was mostly consistent over the course of the week at the surface and mid sondes, increasing slightly at the bottom sonde by week’s end. There were no recorded measurements of hypoxia (DO <2.9 mg/L) at any depths. For the week overall, surface DO averaged 6.8 mg/L with a minimum of 5.9 mg/L, mid averaged 6.5 mg/L with a minimum of 5.7 mg/L, and bottom averaged 6.3 mg/L with a minimum of 5.5 mg/L. Chlorophyll at all depths remained below 25 ug/L again this week, averaging 5.5 ug/L at the surface, 5.7 ug/L at the mid, and 4.6 ug/L at the bottom.
Week of September 22-28, 2019
Nutrients Sampling
Nutrient samples were collected at five local river stations and seven bay stations (surface and bottom) on September 25, 2019. Moderate rainfall of just under 0.3 inches was recorded the day prior to sampling.
Among the river stations sampled, the highest total nitrogen (TN) and the highest dissolved inorganic nitrogen (DIN) values occurred in the sample from the Pawtuxet River at Broad St. site, at 1,500 ppb and 1,127 ppb, respectively. During the time of sampling at this site, there were low water levels and plant particulates observed, which likely contributed to the elevated TN and DIN results. The highest total dissolved nitrogen (TDN) results occurred at both the Pawtuxet River at Broad St. and Blackstone River at Main St. sites, with concentrations of 1,340 ppb; this temporary Blackstone River site is just south of the routine site at Slater Mill, which was inaccessible due to dam repair work at the time of this survey. The lowest TN value (707 ppb) and the lowest TDN value (509 ppb), occurred at the Moshassuck River at Higginson Ave. site, while the lowest DIN concentration (158 ppb) occurred at the Ten Mile River at Roger Williams Ave. site.
At the bay surface stations, the greatest TN results occurred at Phillipsdale Landing, at 1,425 ppb (average of duplicates). TDN and DIN were highest at Pawtuxet Cove, at 666 ppb and 557.5 ppb, respectively. The lowest TN value (724 ppb) occurred at Conimicut Point, while the lowest DIN value (<13 ppb) occurred at Edgewood Yacht Club. Three bay stations had TDN values below detection (<100 ppb) - Conimicut Point, Edgewood Yacht Club, and Bullock Reach. Chlorophyll a concentrations averaged 15.7 ug/L and ranged from 9.6 ug/L at Pomham Rocks to 22.4 ug/L at Phillipsdale Landing (average of duplicates).
Results from nutrients sampling on October 9, October 23, and October 24 are pending laboratory analysis; the next scheduled sample date is November 6.

