Historical News
Surface Mapping
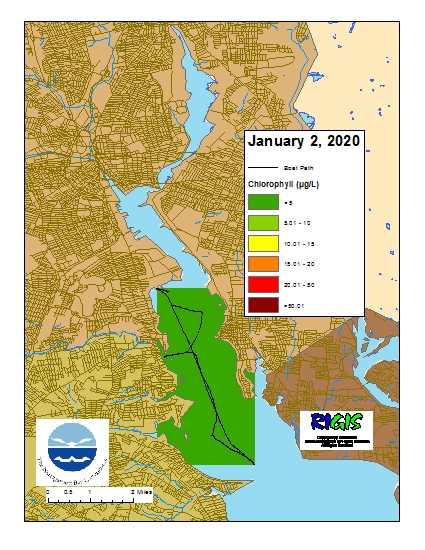
Data were collected on January 2, 2020 while the R/V Monitor was underway collecting nutrient samples in the Providence River estuary. The chlorophyll concentrations were good. From north to south, average chlorophyll concentrations were as follows: Upper Providence River (1.72 µg/L), Edgewood Shoals area (1.72 µg/L), Pawtuxet River area (2.39 µg/L), and Lower Providence River area (1.91 µg/L). Overall, chlorophyll ranged between non-detectable and 3.90 µg/L with an overall average of 1.95 µg/L. The chlorophyll data from this date are presented in the map below:
Water Column Clarity
Water clarity was measured at four locations in the Providence River on December 24, 2019. The three days prior to the survey were dry, with no recorded rainfall. The average Secchi depth reflected decreased clarity since the last survey on December 4, from 3.2 m to 2.1 m. Three sites exhibited decreased clarity since the last survey, with the greatest decrease (down 1.20 m) observed at Edgewood Yacht Club. The remaining site (Point St. Bridge) had not been surveyed recently. Water clarity ranged from 1.4 m at India Point Park to 2.9 m at Bullock Reach. Overall, water clarity in Upper Narragansett Bay increased from north to south.
Nutrients Sampling
Nutrients Sampling
Fixed Site Network
Phillipsdale Landing
Water quality was good this week at Phillipsdale Landing. This week was drier than last week, with 0.69 inches of precipitation recorded at TF Green Airport, however, the impact of nearly 2 inches of rainfall occurring on December 14 was evident in the early portion of the week. Surface and bottom salinity generally remained low through December 15 and 16 and began to increase through the remainder of the week. Surface salinity averaged 3 ppt, ranging from 0.2 to 8.1 ppt, while bottom salinity averaged 11.2 ppt, ranging from <1 ppt to 28 ppt.
Water temperatures at both depths continued to cool; surface temperatures for the week averaged 2.8°C, with a maximum value of 5.2°C, and bottom temperatures averaged 4.0°C, with a maximum value of 6.6°C. Flows of cool Blackstone River water (<3°C) continued to influence surface temperatures. Dissolved oxygen (DO) concentrations continue to remain above the hypoxia threshold (> 2.9 mg/L) at both depths. Average DO concentrations were greater than those reported last week, with surface DO averaging 13.5 mg/L, with a minimum of 12.6 mg/L, and bottom DO averaging 11.8 mg/L, with a minimum of 14.1 mg/L. Surface chlorophyll-a remained low this week, averaging 2.7 ug/L with a maximum of 4.9 ug/L. Note that tidal fluctuations and Blackstone River flow greatly influence water column DO, temperature, and salinity at this location.
Bullock Reach
Please note, the Bullock Reach sondes were removed for the 2019 monitoring season on November 19.

