Historical News
R/V Monitor's Blog
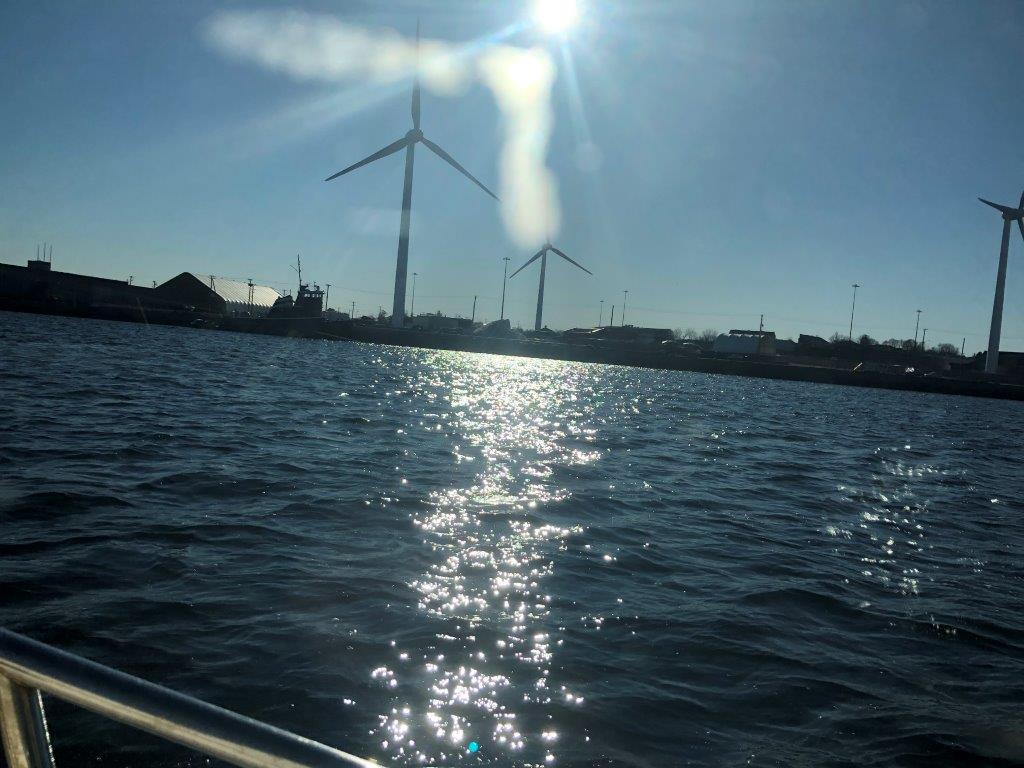
On Wednesday, January 29th, the crew of the R/V Monitor was out on the upper Bay collecting nutrients samples and taking Secchi Disk water clarity measurements. Due to equipment malfunctions and time constraints, real-time surface mapping and water column profiles were not conducted this day. Sara captained the boat while monitoring professionals Steve and Fern collected the samples and data. It was a sunny but cold day with a breeze out of the northwest. The water was very calm. The Port of Providence with NBC's wind turbines in the background are visible in the featured photo.
Phytoplankton Sampling
Phytoplankton samples were collected on January 15, 2020 at Bullock's Reach and analyzed in the laboratory shortly after collection. It was a sunny and brisk day with a west-northwest wind, about 8-11 knots, on Narragansett Bay. Sondes data revealed the surface water temperature was 6.23oC, salinity was 24.46 psu, and chlorophyll a was 2.3 ug/L. The plankton tow net sample was filterable with a 20 micron mesh. The filtrate was a tan color and had a short filter time. The tow net sample was analyzed qualitatively for microorganisms using 100x phase contrast microscopy. The whole water sample was analyzed quantitatively under 200x phase contrast microscopy. A Hensen Stempel pipette was used to accurately deliver 1ml of sample to a Sedge-wick Rafter chamber. This analysis revealed a total of 190,000 cells per Liter. The most predominant phytoplankton was Skeletonema spp.at 130,000 cells/L. The flagellates were found at 16,000 cells/L. Representative genera include Leptocylindrus spp., Gonyaulax spp., and Chaetoceros spp.
200x phase contrast micrograph of a diatomic phytoplankton
Nutrients Sampling
Nutrient samples were collected at fourteen local and border river stations and seven bay stations on December 4, 2019; most bay stations were sampled at the surface only, with Edgewood Shoal sampled at the surface and bottom. The sampling day was preceded by approximately 0.3 inches of rainfall over the three days prior.
Among the river stations sampled, the highest total nitrogen (TN), total dissolved nitrogen (TDN), and dissolved inorganic nitrogen (DIN) were observed in the sample from the Ten Mile River at Central Avenue, at 2,820 ppb, 3,200 ppb, and 2,534 ppb, respectively. The lowest TN (537 ppb) and TDN (543 ppb) results were observed at the Woonasquatucket River at Manton Avenue Bridge. The lowest DIN results were observed at Coles River at Milford Road, with 163.5 ppb.
Among the bay stations sampled, the greatest TN (1,170 ppb), TDN (1,070 ppb), and DIN (856 ppb) in surface waters occurred at Phillipsdale Landing. The lowest surface TN (476 ppb), TDN (112 ppb), and DIN (227.2 ppb) occurred at Bullock Reach Buoy. Chlorophyll a concentrations averaged 0.98 ug/L, with a maximum result of 1.89 ug/L occurring at Edgewood Shoal.
Results from sampling on January 2 and 15 are pending analysis. The next scheduled date of sampling is January 29, 2020.
Water Column Clarity
Water clarity was measured at two locations in the Providence River on January 15, 2020; the strong winds and waves prevented water clarity measurements from being taken at all sites. In the three days prior to sampling, 0.15 inches of rainfall was recorded. The average Secchi depth (3.2 m) remained the same since the last survey, however, water clarity was only measured at one site surveyed in the previous survey this week. At Pawtuxet Cove, water clarity increased by 0.07 m, from 3.23 on January 2 to 3.30 on January 15. Water clarity at the remaining site, India Point Park, was 3.1 m.
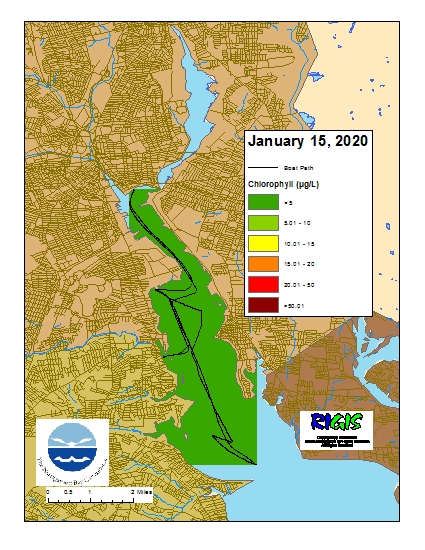
Surface Mapping
Data were collected on January 15, 2020 while the R/V Monitor was underway collecting nutrient samples in the Providence River estuary. The chlorophyll concentrations were good. From north to south, average chlorophyll concentrations were as follows: Upper Providence River (0.44 µg/L), Edgewood Shoals area (0.50 µg/L), Pawtuxet River area (0.49 µg/L), and Lower Providence River area (0.52 µg/L). Overall, chlorophyll ranged between non-detectable and 0.90 µg/L with an overall average of 0.49 µg/L. The chlorophyll data from this date are presented in the map below: