Historical News
Surface Mapping
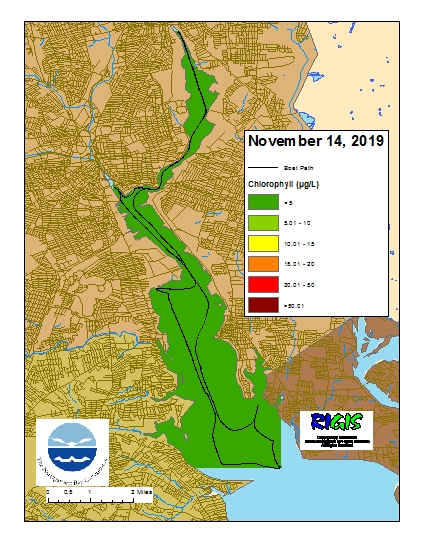
Data were collected on November 14, 2019 while the R/V Monitor was underway collecting bacteria samples in the Seekonk and Providence River estuaries. The chlorophyll concentrations were good. From north to south, average chlorophyll concentrations were as follows: Seekonk River (1.47 µg/L), Upper Providence River (0.95 µg/L), Edgewood Shoals area (0.77 µg/L), Pawtuxet River area (1.06 µg/L), and Lower Providence River area (0.96 µg/L). Overall, chlorophyll ranged between non-detectable and 4.00 µg/L with an overall average of 1.12 µg/L. The chlorophyll data from this date are presented in the map below:
R/V Monitor's Blog
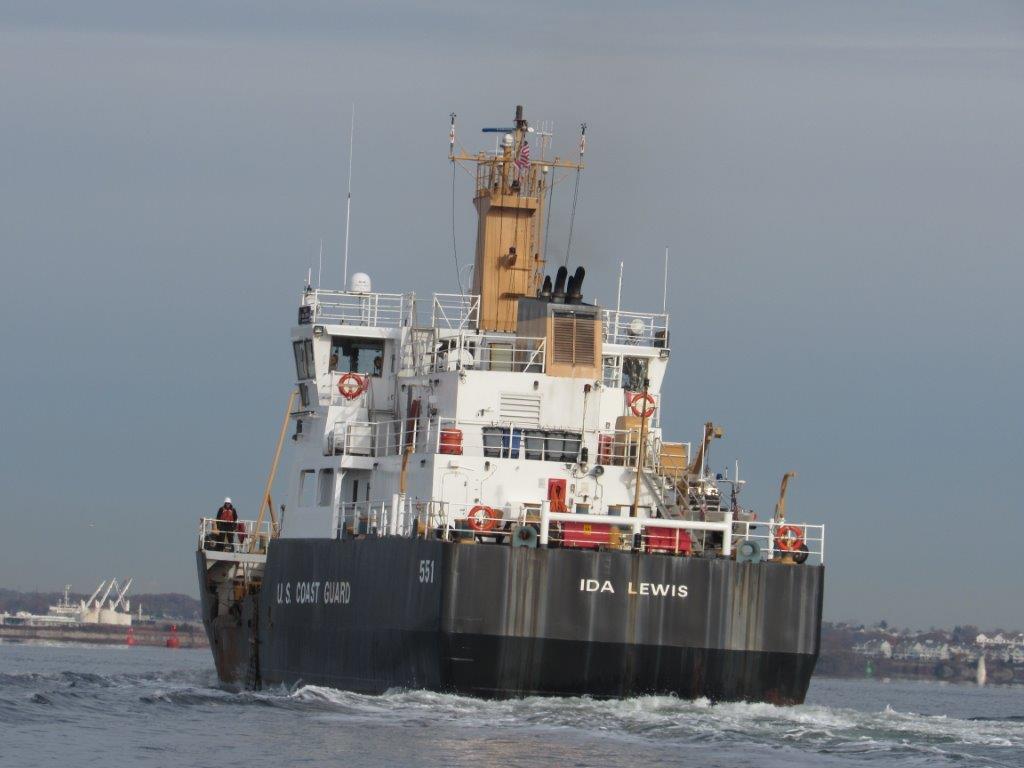
On Thursday, November 14th, the crew of the R/V Monitor was out on the upper Bay collecting bacteria samples, taking Secchi Disk water clarity measurements, and conducting real-time surface mapping of water quality parameters, including dissolved oxygen, chlorophyll, water temperature, salinity, and pH, all in an effort to document water quality improvements associated with NBC construction projects. Water column profiles and Par measurements were not done this day, as the equipment is being calibrated. Sara captained the boat while monitoring professionals Steve and Amanda collected the samples and data. It was a cold and cloudy day with no wind and glass-like waters. Today's photo features a US Coast Guard vessel observed on the Bay.
Nutrients Sampling
Nutrient samples were collected at fourteen river stations and in surface waters of one bay station on October 9, 2019. Bay sampling by boat was cancelled due to adverse weather conditions. In the five days prior to sampling, 0.32 inches of precipitation was recorded.
Among the river stations sampled, highest nitrogen concentrations occurred at Ten Mile River at Central Ave, with results of 2180 ppb total nitrogen (TN), 2070 ppb total dissolved nitrogen (TDN), and 1847 ppb dissolved inorganic nitrogen (DIN). Lowest TN, TDN, and DIN concentrations occurred at Runnins River at River Road, Pawtuxet River at Broad Street, and Warren Reservoir/Kickemuit River, respectively. One bay station, Phillipsdale Landing, was sampled at the surface of the water column. Nitrogen results from this sample were 965 ppb TN, 649 ppb TDN, and 484 DIN.
Results from sampling on October 23, 24, and November 6 are pending laboratory analysis. The next scheduled sample date is November 20.
Water Column Profiles
Water column profiles were measured at five sites in the Providence River on October 24, 2019. A sixth site, Bullock Reach, was also surveyed however a malfunction with the instrument caused the data to be incomplete and unusable. The two days prior to the survey were rainy, with 0.16 inches recorded on October 22 and 0.42 inches recorded on October 23 (TF Green gauge data). Salinity stratification was observed at three sites (Pomham Rocks, Conimicut Point, and India Point Park), while the remaining two sites exhibited well-mixed conditions.
Surface salinities were highest at Pomham Rocks (29 psu), and lowest at India Point Park (25 psu). The highest bottom salinity (31 psu) was observed at Pomham Rocks and Conimicut Point, while the lowest (29 psu) was observed at Pawtuxet Cove. The warmest waters overall were observed at Pawtuxet Cove, from 15.8°C at the surface to 15.6°C at the bottom. The coolest surface waters (14.3°C) were observed at Conimicut Point, while the coolest bottom waters (15.1°C) were observed at India Point Park and Pomham Rocks.
This week, hypoxic conditions (e.g., dissolved oxygen [DO] concentrations <2.9 mg/L) were not observed at any of the sites. Surface and bottom DO ranged from 5 to 7 mg/L across all sites. Fluorescence was much lower than previous surveys on September 25, averaging 1.4 mg/m3 among all sites, with a maximum of 3.1 mg/m3 at 3.25 – 3.5 m at Conimicut Point.
Phytoplankton Sampling
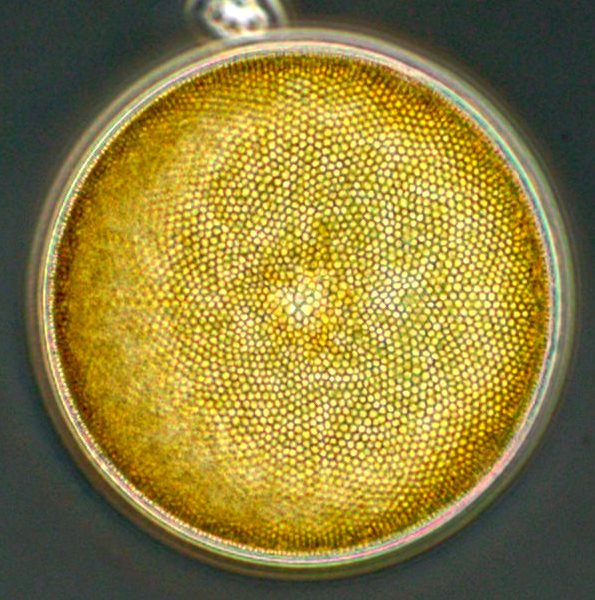
Phytoplankton samples were collected on October 24, 2019 at Bullock's Reach and analyzed in the laboratory shortly after collection. It was a clear and calm day, with abundant sunshine on Narragansett Bay. Sondes data revealed the surface water temperature was 14.40oC, salinity was 25.86 psu, and chlorophyll a was 1.4 ug/L. There was noticeable jellyfish in the sample. The plankton tow net sample was filterable with a 20 micron mesh. The filtrate was a tan color and had a medium filter time. The tow net sample was analyzed qualitatively for microorganisms using 100x phase contrast microscopy. The whole water sample was analyzed quantitatively under 200x phase contrast microscopy. A Hensen Stempel pipette was used to accurately deliver 1ml of sample to a Sedge-wick Rafter chamber. This analysis revealed a total of 108,000 cells per Liter. The most predominant phytoplankton was Leptocylindrus spp.at 68,000 cells/L. The flagellates were found at 32,000 cells/L. Representative genera include Guinardia spp. and Chaetoceros spp.
200x phase contrast micrograph of a centric diatom