Historical News
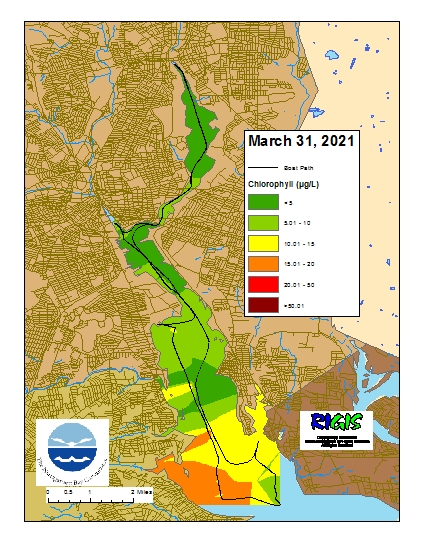
Surface Mapping
Data were collected on March 31, 2021 while the R/V Monitor was underway collecting bacteria samples in the Seekonk and Providence River estuaries. The chlorophyll concentrations ranged from good to fair in a north to south gradient in the areas surveyed. From north to south, average chlorophyll concentrations were as follows: Seekonk River (5.07 µg/L), Upper Providence River (5.53 µg/L), Edgewood Shoals area (7.83 µg/L), Pawtuxet River area (9.55 µg/L), and Lower Providence River (11.83 µg/L). Overall, chlorophyll ranged between 1.80 µg/L and 20.60 µg/L with an overall average of 7.16 µg/L. The chlorophyll data from this date are presented in the map below:
Phytoplankton Sampling
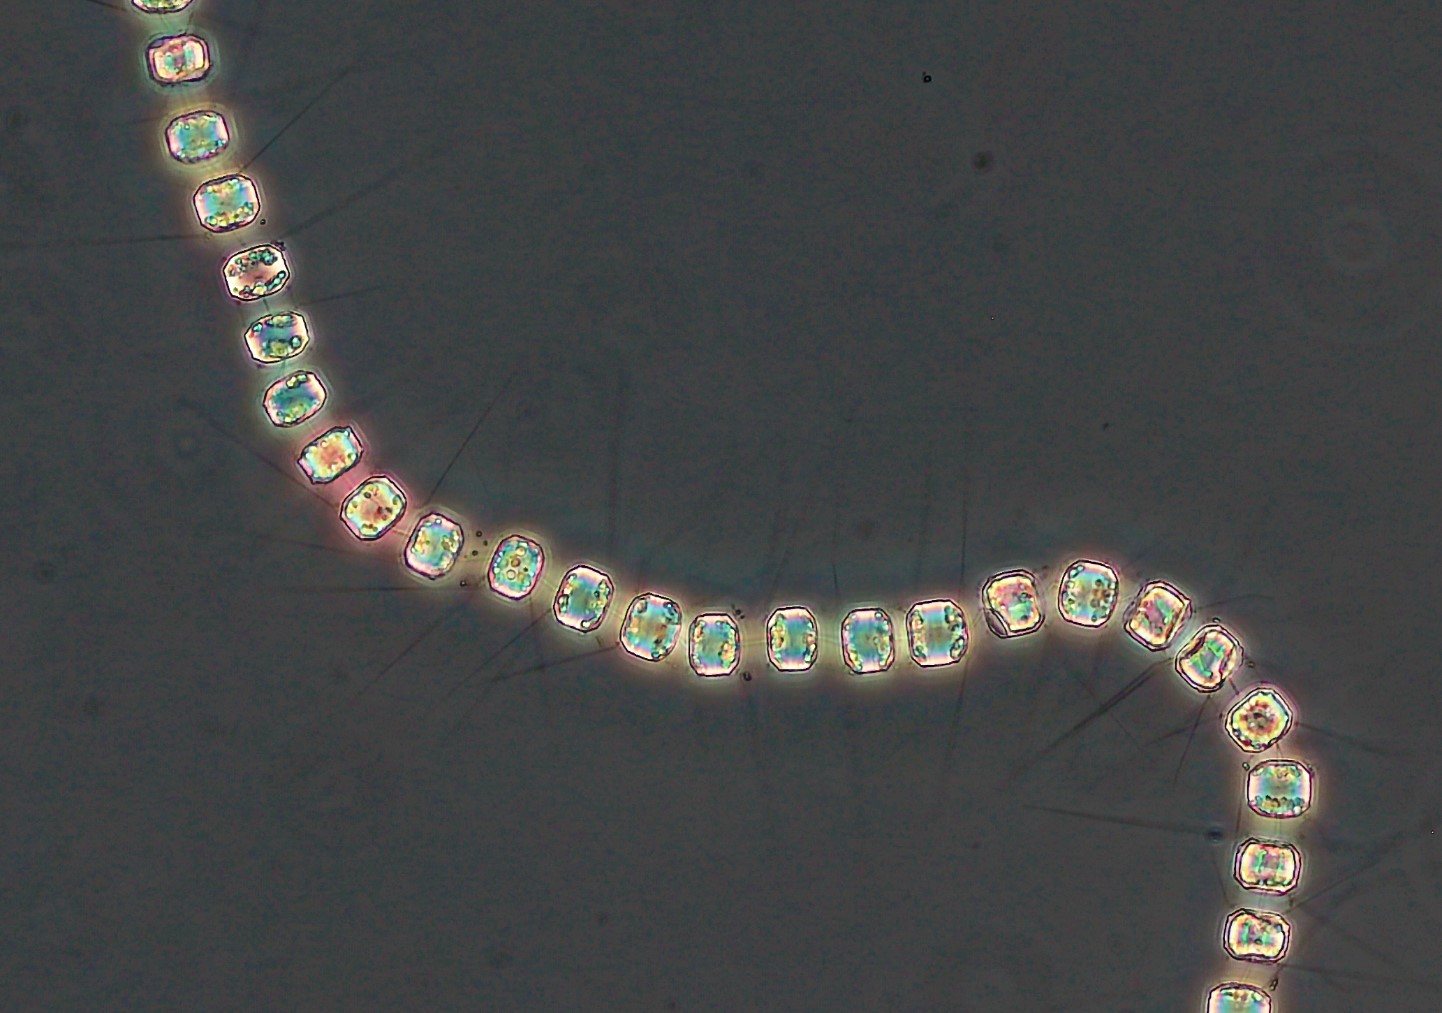
Phytoplankton samples were collected on March 23, 2021 at Bullock Reach and analyzed in the laboratory shortly after collection. It was a cool, partly sunny day on Narragansett Bay with calm conditions. Sondes data revealed the surface water temperature was 9.24°C, salinity was 18.61 psu, and chlorophyll a was 9.2 ug/L. The plankton tow net sample was filterable with a 20 micron mesh. The filtrate was a light tan color and had a quick filter time. The tow net sample was analyzed qualitatively for microorganisms using 100x phase contrast microscopy. The whole water sample was analyzed quantitatively under 200x phase contrast microscopy. A Hensen Stempel pipette was used to accurately deliver 1ml of sample to a Sedge-wick Rafter chamber. This analysis revealed a total of 948,000 cells per Liter. The flagellates were found at 70,000 cells/L. The most predominant phytoplankton was Thalassiosira spp. at 586,000 cells/L. Representative genera include Skeletonema spp., Chaetoceros spp., and Thalassionema spp.
200x phase contrast image of Thalassiosira spp.
Water Column Profiles
R/V Monitor's Blog
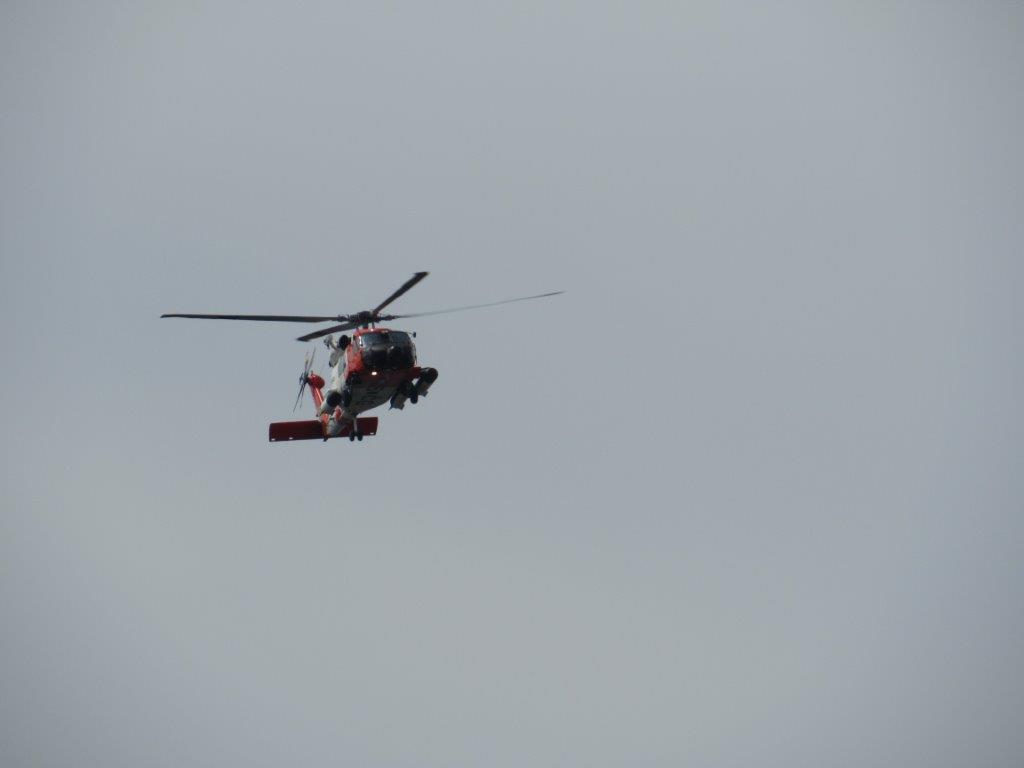
On Wednesday, March 24th, the crew of the R/V Monitor was out on the upper Bay collecting nutrients and plankton samples, taking Secchi Disk and Par sensor water clarity measurements, conducting water column profiles using the Seabird instrument, and conducting real-time surface mapping of water quality parameters, including dissolved oxygen, chlorophyll, water temperature, salinity, and pH, all in an effort to document water quality improvements associated with NBC construction projects. Jeff captained the boat while monitoring professionals Sara and Mike collected the samples and data. It was a cool partly sunny day with little to no wind and calm waters. The featured photo is of a US Coast Guard helicopter flying overhead this day. They were searching for a sunken vessel.
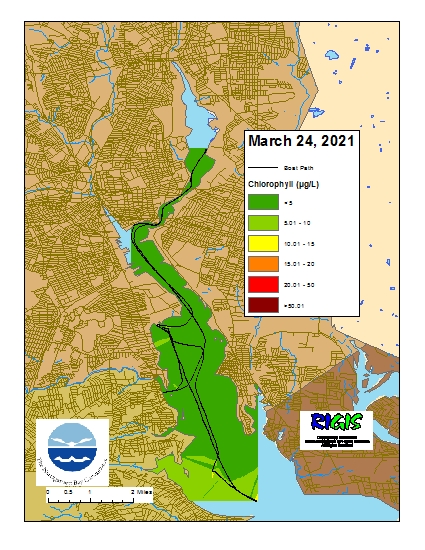
Surface Mapping
Data were collected on March 24, 2021 while the R/V Monitor was underway collecting nutrient samples in the Seekonk and Providence River estuaries. The chlorophyll concentrations were good in the areas surveyed. From north to south, average chlorophyll concentrations were as follows: Seekonk River (2.44 µg/L), Upper Providence River (2.10 µg/L), Edgewood Shoals area (5.12 µg/L), Pawtuxet River area (2.87 µg/L), and Lower Providence River (9.47 µg/L). Overall, chlorophyll ranged between non-detectable and 21.80 µg/L with an overall average of 5.04 µg/L. The chlorophyll data from this date are presented in the map below: