Historical News
R/V Monitor's Blog
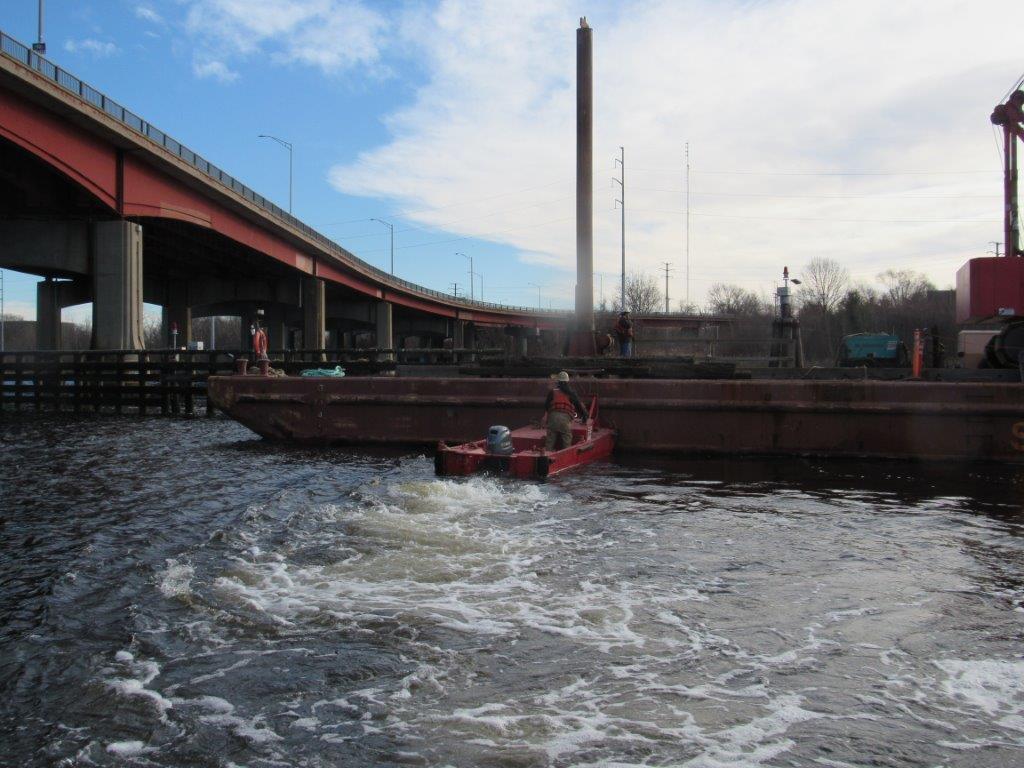
On Tuesday, December 24th, the crew of the R/V Monitor was out on the upper Bay collecting bacteria samples, taking Secchi Disk water clarity measurements, and attempted to collect real-time surface mapping of water quality parameters, but there were some technical issues with the equipment. Sara captained the boat while monitoring professionals Bekki and Amanda collected the samples and data. It was a very cold day, partly cloudy and no wind. A barge observed in the Seekonk River was photographed this day.
Bacteria Sampling
Twenty stations were sampled for fecal coliform bacteria in the Providence and Seekonk Rivers on December 24, 2019. Five stations were also sampled for enterococci. There was no recorded precipitation in the five days prior to sampling.
The geometric mean of fecal coliform results for all sites was 19 MPN/100 mL, a slight increase compared to 12 MPN/100 mL during the previous sampling event on November 14. Counts were higher at the Seekonk River sites than the Providence River sites, with geometric means of 28 and 16 MPN/100 mL, respectively. The maximum count (230 MPN/100 mL) was measured at the Off FP Outfall site in the Providence River. Results for both the Providence River and the Seekonk River were within state standards for primary contact but exceeded standards for shellfishing.
The enterococci results decreased very slightly from the previous sampling event on November 14, from 13 MPN/100 mL to 12 MPN/100 mL. Enterococci results ranged from <10 MPN/100 mL at two sites (Gaspee Point and Conimicut Point) to 41 MPN/100mL at Point St. Bridge. These enterococci results were within state standards for primary contact.
Please note: the results of NBC's fecal coliform and enterococci monitoring are for informational/research purposes only and are not intended to suggest official state compliance with bathing and shellfishing standards.
Surface Mapping
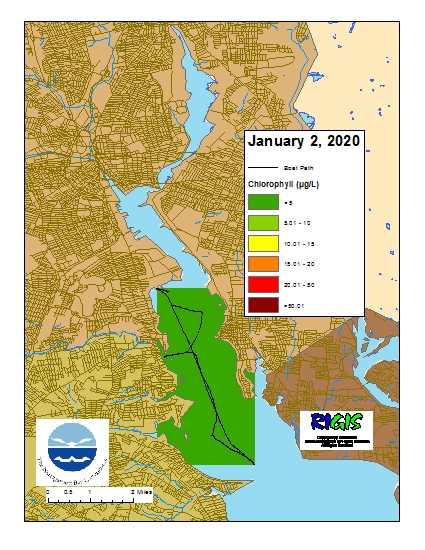
Data were collected on January 2, 2020 while the R/V Monitor was underway collecting nutrient samples in the Providence River estuary. The chlorophyll concentrations were good. From north to south, average chlorophyll concentrations were as follows: Upper Providence River (1.72 µg/L), Edgewood Shoals area (1.72 µg/L), Pawtuxet River area (2.39 µg/L), and Lower Providence River area (1.91 µg/L). Overall, chlorophyll ranged between non-detectable and 3.90 µg/L with an overall average of 1.95 µg/L. The chlorophyll data from this date are presented in the map below:
Water Column Clarity
Water clarity was measured at four locations in the Providence River on December 24, 2019. The three days prior to the survey were dry, with no recorded rainfall. The average Secchi depth reflected decreased clarity since the last survey on December 4, from 3.2 m to 2.1 m. Three sites exhibited decreased clarity since the last survey, with the greatest decrease (down 1.20 m) observed at Edgewood Yacht Club. The remaining site (Point St. Bridge) had not been surveyed recently. Water clarity ranged from 1.4 m at India Point Park to 2.9 m at Bullock Reach. Overall, water clarity in Upper Narragansett Bay increased from north to south.
Nutrients Sampling

