Historical News
R/V Monitor's Blog
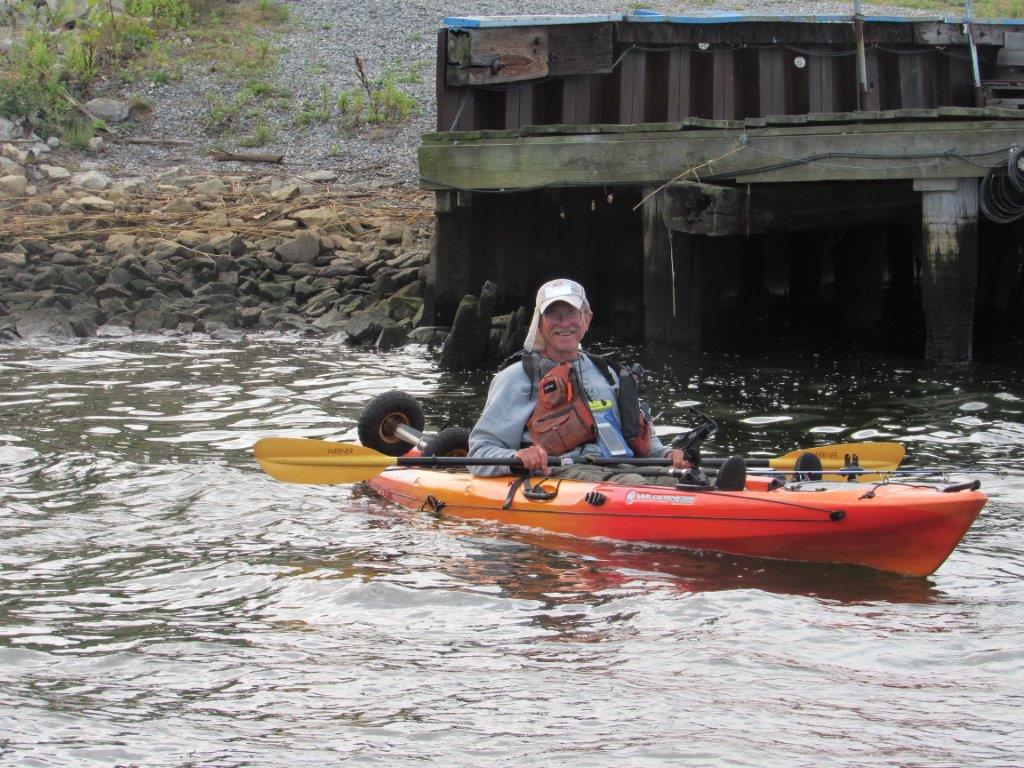
On Wednesday, September 16th, the crew of the R/V Monitor was out on the upper Bay collecting bacteria samples, taking Secchi Disk and Par sensor water clarity measurements, conducting water column profiles using the Seabird instrument, and conducting real-time surface mapping of water quality parameters including dissolved oxygen, chlorophyll, water temperature, salinity, and pH, all in an effort to document water quality improvements associated with NBC construction projects. Sara captained the boat while monitoring professionals Bekki, Gerard and Sara collected the samples and data. In the afternoon, Jeff captained the boat while the crew serviced the temporary buoy located in Pawtuxet Cove and collected a chlorophyll sample at that site. The day started brisk with little wind and a hazy sky. By afternoon, the sun broke through the haze, warming the air up nicely and a Southwest wind developed. The featured photo is of a kayaker enjoying the day by Phillipsdale landing in the Seekonk River.
Fixed Site Network
Water quality was fair to poor this week at Phillipsdale Landing. Conditions have been relatively dry; precipitation totaled 0.03 inches this week.
Water column salinity increased over the course of the week. Surface salinity averaged 20.8 ppt and ranged from 15.0 ppt to 25.6 ppt. Bottom salinity averaged 26.5 ppt and ranged from 20.1 ppt to 30.3 ppt. This week, surface and bottom temperatures averaged 23.5°C and 23.3°C, respectively. Surface temperatures ranged from 20.0°C to 25.2°C, while bottom temperatures ranged from 22.2°C to 24.4°C.
Dissolved oxygen (DO) concentrations remained above the hypoxia threshold (2.9 mg/L) at the surface depth through the duration of the deployment. Surface DO averaged 7.8 mg/L, with a minimum of 4.2 mg/L. Hypoxic conditions (DO ≤ 2.9 mg/L) were observed in bottom waters, where a minimum DO concentration of 1.1 mg/L was recorded in the latter half of the week. Bottom DO averaged 3.6 mg/L for the deployment period. Surface chlorophyll averaged 45.6 ug/L, while bottom chlorophyll readings averaged 16.7 ug/L; maximum readings observed at both depths were > 45 ug/L. Please note that tidal fluctuations and Blackstone River flow greatly influence water column salinity, temperature, and DO at this location.
Bullock Reach
Water quality was good this week at Bullock Reach. Sondes were changed out for routine maintenance on the morning of September 9. Please note, a specific conductivity/temperature sensor was replaced on the mid-depth sonde on September 3rd after the sensor sustained damage in the field; impacted data are excluded from this analysis. Surface salinity averaged 29.2 ppt and ranged from 26.6 ppt to 30.4 ppt. Salinity increased with depth, averaging 30.4 ppt at the middle of the water column (range: 28.0 ppt to 32.1 ppt) and 31.2 ppt at the bottom of the water column (range: 30.3 ppt to 32.2 ppt). Temperatures averaged 23.0°C, 22.7°C, and 22.1°C at the surface, middle, and bottom of the water column, respectively. Surface temperatures ranged from 21.5°C to 24.5°C, mid temperatures ranged from 21.7°C to 23.7°C, and bottom temperatures ranged from 21.3°C to 22.7°C.
Dissolved oxygen (DO) concentrations remained above the hypoxia threshold (2.9 mg/L) at the surface depth. Surface DO averaged 7.9 mg/L, with a minimum of 5.9 mg/L. Mid DO averaged 6.2 mg/L, with a minimum of 2.6 mg/L, and bottom DO averaged 4.1 mg/L, with a minimum of 1.3 mg/L. Bottom DO generally decreased over the course of the week, as salinity stratification increased. Surface chlorophyll averaged 12.4 ug/L, mid chlorophyll averaged 7.3 ug/L, and bottom chlorophyll averaged 31.3 ug/L this week, with maximum concentrations of > 30 ug/L observed at all depths.
Surface Mapping
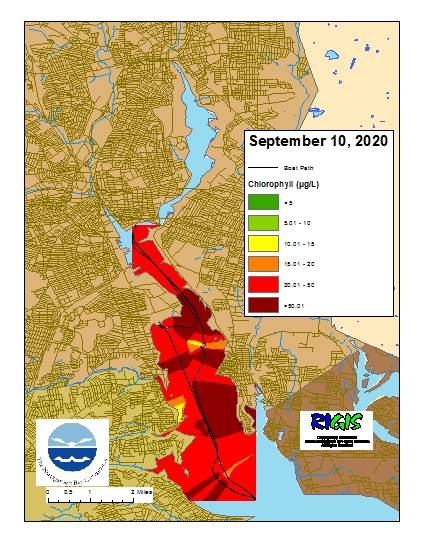
Data were collected on September 10, 2020 while the R/V Monitor was underway collecting nutrient samples and performing vertical profiles in the Providence River estuary. The chlorophyll concentrations were poor in the areas surveyed. From north to south, average chlorophyll concentrations were as follows: Upper Providence River (31.72 µg/L), Edgewood Shoals area (22.24 µg/L), Pawtuxet River area (62.59 µg/L), and Lower Providence River area (26.78 µg/L). Overall, chlorophyll ranged between 10.40 µg/L and 162.40 µg/L with an overall average of 29.72 µg/L. The chlorophyll data from this date are presented in the map below:
R/V Monitor's Blog
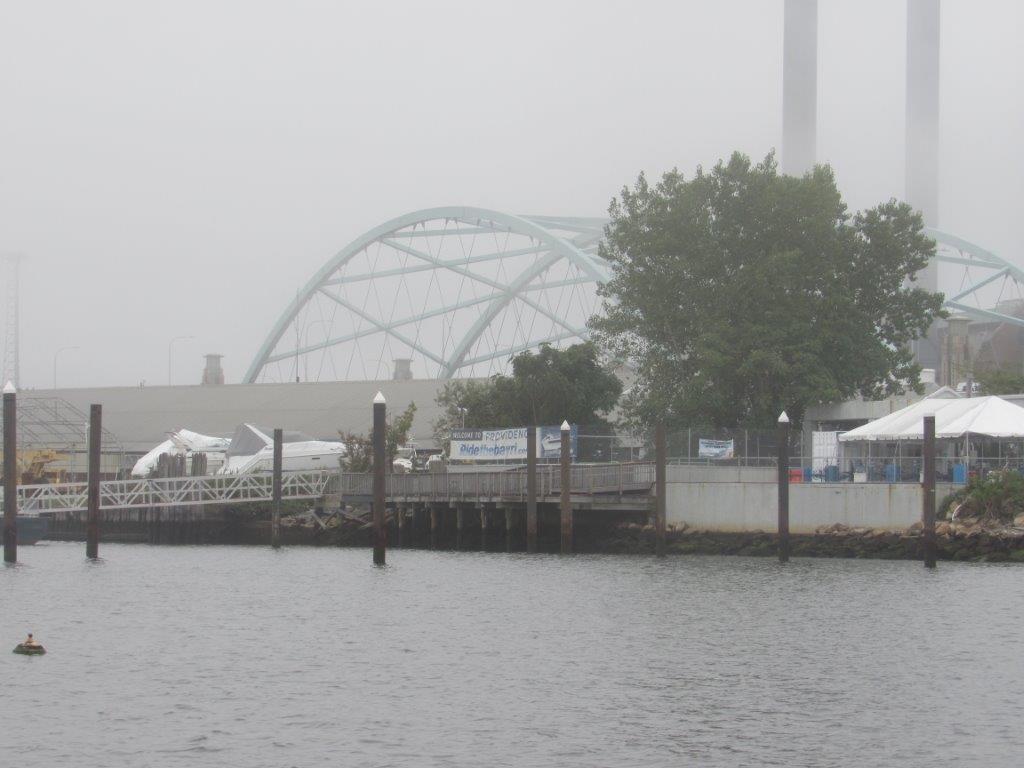
On Thursday, September 10th, the crew of the R/V Monitor was out on the upper Bay collecting nutrients samples, taking Secchi Disk water clarity measurements, and conducting real-time surface mapping of water quality parameters, including dissolved oxygen, chlorophyll, water temperature, salinity, and pH, all in an effort to document water quality improvements associated with NBC construction projects. Sara captained the boat while monitoring professionals Jeff and Steve collected the samples and data. It was a very foggy day with no wind and a light mist. The featured photo was taken at the ferry landing in Providence.
Fixed Site Network
Water quality was fair to poor this week at Phillipsdale Landing. This week, 0.54 inches of precipitation was recorded, with the majority of this rainfall (0.42 in) occurring on September 2. Sondes were changed out for routine maintenance the morning of September 1.
Tides and rainfall influenced fluctuations in water column salinity throughout the week. Surface salinity averaged 20.8 ppt and ranged from 10.4 ppt to 25.8 ppt. Bottom salinity averaged 26.1 ppt and ranged from 19.2 ppt to 30.0 ppt. Surface and bottom temperatures decreased slightly throughout the week, averaging 23.7°C and 23.6°C, respectively. Surface temperatures ranged from 20.5°C to 25.6°C, while bottom temperatures ranged from 22.7°C to 24.7°C.
Hypoxia (dissolved oxygen [DO] ≤ 2.9 mg/L) was observed intermittently in surface waters during the beginning of the week and frequently in bottom waters throughout the week. Surface DO averaged 5.9 mg/L and ranged from 2.0 mg/L to 11.4 mg/L. Bottom DO averaged 3.2 mg/L and ranged from 1.3 mg/L to 8.3 mg/L. The greatest duration of bottom hypoxia this week occurred for approximately 24 hours from the afternoon of August 30th to the afternoon of August 31st. Surface chlorophyll averaged 28.1 ug/L, while bottom chlorophyll readings averaged 13.8 ug/L; maximum readings observed at both depths were > 35 ug/L. Please note that tidal fluctuations and Blackstone River flow greatly influence water column salinity, temperature, and dissolved oxygen at this location.
Bullock Reach
Water quality was good this week at Bullock Reach. Please note, a specific conductivity/temperature sensor was replaced on the mid-depth sonde on September 3 after the sensor sustained damage in the field; impacted data are excluded from this analysis. Surface salinity averaged 29.2 ppt and ranged from 27.3 ppt to 30.5 ppt. Salinity increased with depth, averaging 30.6 ppt at the middle of the water column (range: 29.1 ppt to 32.4 ppt) and 31.0 ppt at the bottom of the water column (range: 29.9 ppt to 32.1 ppt). Temperatures at all three depths decreased slightly throughout the week, averaging 22.9°C, 22.6°C, and 22.2°C at the surface, middle, and bottom of the water column, respectively. Surface temperatures ranged from 22.1°C to 24.6°C, mid temperatures ranged from 21.9°C to 23.3°C, and bottom temperatures ranged from 21.3°C to 23.1°C.
Dissolved oxygen (DO) concentrations remained above the hypoxia threshold (2.9 mg/L) at all three depths. Surface DO averaged 7.5 mg/L, with a minimum of 5.1 mg/L. Mid DO averaged 6.3 mg/L, with a minimum of 4.0 mg/L, and bottom DO averaged 5.0 mg/L, with a minimum of 3.4 mg/L. Surface chlorophyll averaged 12.4 ug/L, with a maximum concentration of 71.6 ug/L. Chlorophyll concentrations of ≥ 25 ug/L were also observed at the mid and bottom depths.

