Historical News
Week of August 30 - September 5, 2020
Water Column Profiles
Water column profiles were measured at seven sites in the Seekonk and Providence Rivers on September 2, 2020. Weather leading up to the survey was mostly dry, though a rain event began toward the end of the survey period and trace rainfall may have impacted these readings. Minor density stratification was observed at two sites (Edgewood Yacht Club and India Point Park), while the remaining sites were more well-mixed. The highest salinities were observed at Conimicut Point, 29 psu at the surface and 31 psu at the bottom. The lowest salinities were observed at Phillipsdale Landing, around 20 psu at the surface and 27 psu at the bottom. The warmest waters were observed at Point St. Bridge, where surface waters reached 27.6°C and bottom waters were 26.5°C. Waters were cooler at Bullock Reach and Conimicut Point, around 22°C throughout the water column. Dissolved oxygen (DO) concentrations were fair to good at most sites, except for India Point Park where waters were hypoxic (<2.9 mg/L DO) below 5 meters. Fluorescence data suggest moderate phytoplankton activity at several sites, highest at Phillipsdale Landing. Due to a QC issue, numerical fluorescence data are not posted at this time.
This was the first survey of 2020 using the NBC’s new Seabird Electronics 19plus V2 Profiler CTD; in years prior, the NBC used an older model SBE 19plus profiler. The SBE instruments had been at the manufacturer’s for servicing through much of 2020. Previous surveys this year were conducted using a YSI EXO sonde to measure surface and bottom conditions. YSI EXO data from earlier this year remain available upon request; they are not included in the public data file here on Snapshot because the instrument was not optimized for true profile readings.
Week of August 23 - 29, 2020
Nutrients Sampling
Nutrient samples were collected at 15 local and border river stations on August 26, 2020. This survey was preceded by substantial rainfall of 0.38 inches four days prior and 0.46 inches two days prior. The highest nitrogen concentrations were observed in the sample from the Ten Mile River @ Central Ave.; total nitrogen (TN) at this site measured 1,980 ppb while total dissolved nitrogen (TDN) and dissolved inorganic nitrogen (DIN) measured 1,890 ppb and 1,522 ppb, respectively. In contrast, the lowest TN (638 ppb) was observed downstream at the Ten Mile River @ Roger Williams Ave. site. TDN was lowest (286 ppb) at Pawtuxet River @ Broad St., while DIN concentrations were lowest (13 ppb) at Palmer River @ Rt. 6.
Results from sampling on September 10 and September 23 are pending analysis.
Week of August 9 - 15, 2020
Nutrients Sampling
Nutrient samples were collected at eight Bay stations, surface and bottom, on August 13, 2020. Weather leading up the sample day was dry, with just 0.01 inches recorded the day prior; the most recent rainfall before that was 0.19 inches on August 4th. The highest surface total nitrogen (TN) concentration was observed in the sample from Edgewood Yacht Club, at 6,820 ppb; total dissolved nitrogen (TDN) and dissolved inorganic nitrogen (DIN) were lower, 592 ppb and 20.5 ppb, respectively. This station also had elevated total suspended solids (93.47 ppm) and chlorophyll (423 ug/L); all of this points to substantial phytoplankton activity. Dissolved nitrogen (i.e., TDN and DIN) was highest at Pawtuxet Cove, at 829 ppb 470 ppb, respectively. The lowest TN and TDN occurred at the Bullock Reach Buoy site, which had reported values of 846 ppb and 283 ppb, respectively. DIN concentrations were lowest (13 ppb) at Pomham Rocks and Phillipsdale Landing. While the highest chlorophyll concentrations were observed at Edgewood Yacht Club, additional sites (Conimicut Point, Pomham Rocks, Phillipsdale Landing, Edgewood Shoal) exhibited elevated chlorophyll (e.g., >50 ug/L), indicative of phytoplankton bloom activity. A known Cochlodinium bloom (“rust tide”) was occurring throughout Narragansett Bay at this time.
Results from sampling on August 26, September 10, and September 23 are pending analysis.
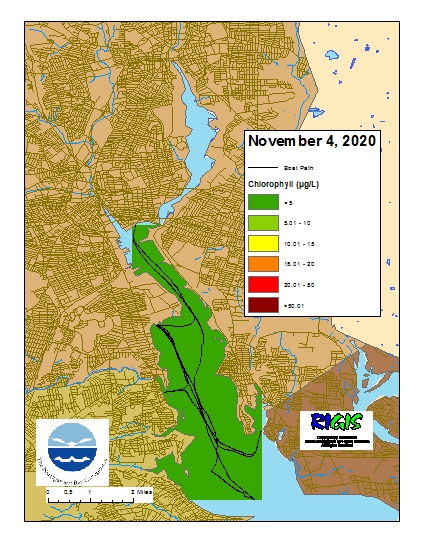
Week of November 1 – November 7, 2020
Surface Mapping
Data were collected on November 4, 2020 while the R/V Monitor was underway collecting nutrient samples and performing vertical profiles in the Providence River estuary. The chlorophyll concentrations were good in the areas surveyed. From north to south, average chlorophyll concentrations were as follows: Upper Providence River (1.52 µg/L), Edgewood Shoals area (2.49 µg/L), Pawtuxet River area (2.47 µg/L), and Lower Providence River area (1.81 µg/L). Overall, chlorophyll ranged between non-detectable and 4.50 µg/L with an overall average of 1.98 µg/L. The chlorophyll data from this date are presented in the map below:
Week of October 25 - 31, 2020
Fixed Site Network
Phillipsdale Landing
Phillipsdale Landing sondes were changed out for routine maintenance during the morning of October 27. Water quality at this site was good this week. Precipitation totaled 1.81 inches at TF Green, with most falling on October 29 (1.33 in). The following day saw cold temperatures and the first snowfall of the season. Blackstone River flows increased in response to the precipitation, though discharges remain relatively low compared to the long-term median. This week, salinity at the surface averaged 17.9 ppt and ranged from 8.0 ppt to 25.0 ppt. Bottom salinity averaged 26.7 ppt and ranged from 16.1 ppt to 30.1 ppt. Surface and bottom water temperatures continued to cool, averaging 14.4°C and 15.9°C, respectively. Surface temperatures ranged from 9.0°C to 16.5°C, while bottom temperatures ranged from 12.5°C to 17.4°C.
Dissolved oxygen (DO) remained above the hypoxia threshold (2.9 mg/L) in surface and bottom waters this week. Surface DO averaged 7.3 mg/L, with a minimum of 4.7 mg/L, and bottom DO averaged 5.2 mg/L, with a minimum of 4.0 mg/L. Chlorophyll concentrations were low, averaging 7.3 ug/L at the surface and 4.4 ug/L at the bottom. Maximum surface chlorophyll concentrations reached 32.5 ug/L, measured on October 28. Please note that tidal fluctuations and Blackstone River flow greatly influence water column salinity, temperature, and dissolved oxygen at this location.
Bullock Reach
Water quality was good this week at Bullock Reach. Surface salinity averaged 28.2 ppt and ranged from 26.8 ppt to 30.0 ppt. Salinity at the mid depth averaged 29.8 ppt and ranged from 27.5 ppt to 31.6 ppt, while bottom waters averaged 32.4 ppt and ranged from 29.6 ppt to 33.1 ppt. Temperatures averaged 14.9°C, 15.3°C, and 16.1°C at the surface, mid, and bottom, respectively. Surface temperatures ranged from 10.0°C to 16.9°C, mid temperatures ranged from 12.8°C to 16.9°C, and bottom temperatures ranged from 14.3°C to 16.9°C.
Dissolved oxygen (DO) concentrations remained above the hypoxia threshold (2.9 mg/L) throughout the water column. Surface DO averaged 7.3 mg/L, while mid DO averaged 7.0 mg/L. Bottom DO averaged 6.4 mg/L, with a minimum of 5.4 mg/L. Chlorophyll concentrations were low, averaging 3.2 ug/L at the surface, 3.8 ug/L in mid-depth waters, and 2.7 ug/L in bottom waters. The maximum water column chlorophyll concentration was 21.2 ug/L, measured in mid-depth waters on October 25.

