Week of October 23 - 29, 2022
Bacteria Sampling
On October 27, twenty stations were sampled for fecal coliform bacteria in the Providence and Seekonk Rivers. Five of these stations were also sampled for enterococci bacteria. Precipitation in the five days prior to sampling totaled 1.99 inches as recorded at TF Green.
Overall, bacteria counts were lower this week than during the previous sampling event on October 12. The geometric mean of fecal coliform results for all sites was 76 MPN/100 mL compared to 131 MPN/100 mL on October 12. Fecal coliform counts were higher in the Seekonk River sites than in the Providence River sites (geometric means of 126 MPN/100 mL and 60 MPN/100 mL, respectively); however, the maximum count (430 MPN/100 mL) was measured at Point St. Bridge in the Providence River.
Enterococci results had an overall geometric mean of 25 MPN/100 mL. Enterococci results ranged from non-detect at three sites (Phillipsdale Landing, Gaspee Point, and Conimicut Point, to 426 MPN/100 mL at the Point St. Bridge site.
The table below lists the Rhode Island bacteria standards for primary contact and shellfishing established by the Rhode Island Department of Environmental Management (RIDEM). RIDEM defines primary contact as any recreational activities in which there is prolonged and intimate contact with water, involving considerable risk of ingesting water (e.g., swimming, diving, water skiing and surfing). Please note that the RIDEM bacteria standards are provided here for informational purposes only and are not intended to indicate official state compliance with primary contact or shellfishing standards.
Summary of Rhode Island Bacteria Standards for Saltwater Primary Contact and Shellfishing
| Fecal Coliform | Enterococci |
| Primary Contact1 | Geometric mean ≤50 MPN/100 mL
<10% of samples >400 MPN/100 mL
| Geometric mean ≤35 colonies/100 mL
All samples ≤104 colonies/100 mL2 |
| Shellfishing | Geometric mean ≤14 MPN/100 mL
<10% of samples >49 MPN/100 mL3 | NO ENTEROCOCCI CRITERIA
|
1Fecal coliform primary contact criteria applied only when adequate enterococci data are not available;
2Single sample maximum criterion for determining beach swimming advisories at designated beaches as evaluated by the Rhode Island Department of Health;
3For a three-tube decimal dilution
Week of October 23 - 29, 2022
R/V Monitor's Blog
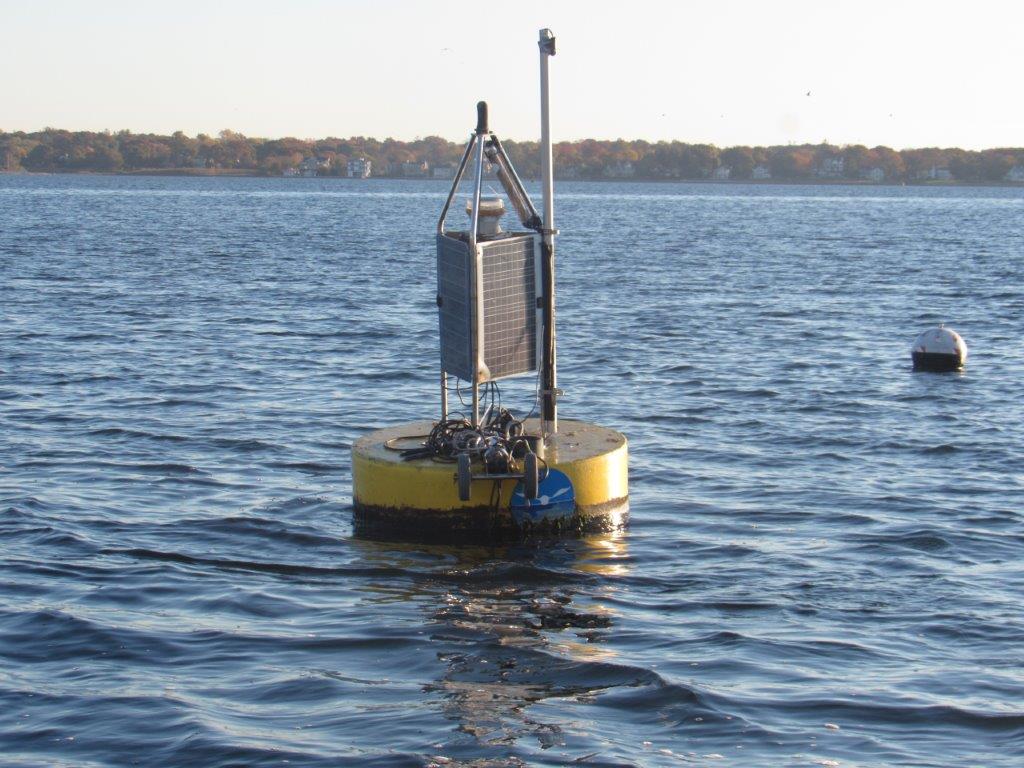
On Thursday, October 27th, the crew of the R/V Monitor was out on the upper Bay collecting bacteria samples, taking Secchi Disk and Par sensor water clarity measurements, conducting water column profiles using the Seabird instrument, and conducting real-time surface mapping of water quality parameters, including dissolved oxygen, chlorophyll, water temperature, salinity, and pH, all in an effort to document water quality improvements associated with NBC construction projects. The Bullock's Reach buoy was also serviced in the afternoon. Sara captained the boat while monitoring professionals Tyler and Amanda collected the samples and data. It was a warm fall day with a strong wind from the north. The chop on the water was noticeable and increased as the day progressed.. The featured photo taken this day is of the NBC's Bullock's Reach buoy.
Week of October 23 – October 29, 2022
Surface Mapping
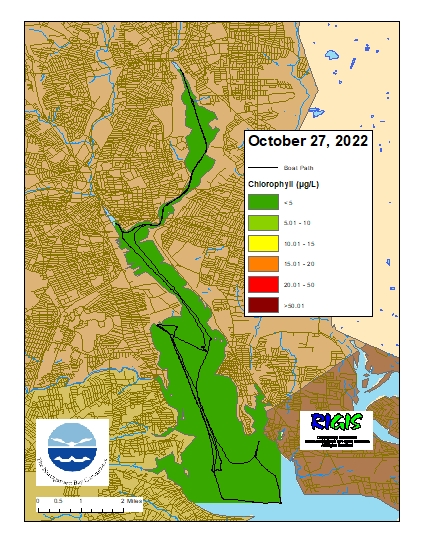
Data were collected on October 27, 2022, while the R/V Monitor was underway collecting bacteria samples in the Providence and Seekonk River estuaries. The average chlorophyll concentrations were good in the areas surveyed. From north to south, average chlorophyll concentrations were as follows: Seekonk River (1.16 µg/L), Upper Providence River (0.89 µg/L), Edgewood Shoals area (1.06 µg/L), Pawtuxet River area (1.23 µg/L), and Lower Providence River (1.36 µg/L). Overall, chlorophyll ranged between 0.55 and 2.14 µg/L with an overall average of 1.16 µg/L. The chlorophyll data from this date are presented in the map below:
Week of October 16 - 22, 2022
Phytoplankton Sampling
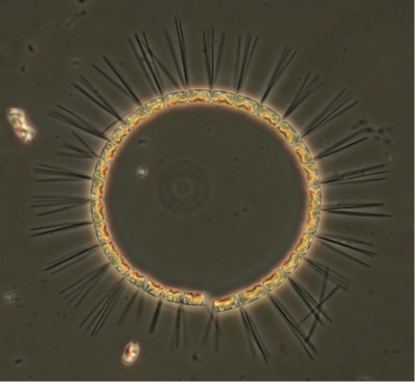
Phytoplankton samples were collected on October 19, 2022 at Bullock Reach and analyzed in the laboratory shortly after collection. It was calm and sunny on Narragansett Bay. Sondes data revealed the surface water temperature was 15.72⁰C, salinity was 24.17 psu, and chlorophyll a was 1.94 ug/L. The plankton tow net sample was filterable with a 20 micron mesh. The filtrate was a light tan color and had a quick filter time. The tow net sample was analyzed qualitatively for microorganisms using phase contrast microscopy. The whole water sample was analyzed quantitatively under 200x phase contrast microscopy. A Hensen Stempel pipette was used to accurately deliver 1ml of sample to a Sedge-wick Rafter chamber. This analysis revealed a total of 521,000 cells per Liter. The microflagellates were found at 107,000 cells/L. The most predominant phytoplankton genus was Skeletonema spp. at 232,000. Other representative genera include Chaetoceros spp., Leptocylindrus spp., and pennate diatoms.
200x phase contrast micrograph of Chaetoceros spp.
Week of October 9 - 15, 2022
Fixed Site Network
Phillipsdale Landing
Overall, water quality at Phillipsdale Landing was good this week. Weather conditions were moderately wet, with 1.63 inches of rainfall recorded at T.F. Green. The heaviest of the rainfall occurred on the 12th and 13th (0.75 and 0.88, respectively) resulting in dramatically increased flows from the Blackstone River toward the end of the week. In response to the heavy rains and increased river flows, salinity at Phillipsdale decreased toward the end of the week. Salinity at the surface averaged 18.2 ppt and ranged from 4.7 ppt – 26.8 ppt. At the bottom, salinity averaged 23.7 ppt and ranged from 9.7 ppt – 28.5 ppt. Temperatures this week averaged 16.9°C at the surface and 17.1°C at the bottom. Surface temperatures ranged from 13.6°C to 18.5°C, while bottom temperatures ranged from 16.5°C to 17.9°C.
Dissolved oxygen (DO) has increased at Phillipsdale Landing, with the surface and bottom waters above the hypoxia threshold (i.e., DO >2.9 mg/L) throughout the week. Bottom water DO concentration averaged 6.2 mg/L and ranged from 4.6 mg/L to 8.9 mg/L. Surface DO was higher, averaging 7.0 mg/L and ranging 5.6 – 8.9 mg/L. Chlorophyll concentrations slightly increased from the previous week, averaging 6.4 ug/L at the surface and 4.4 ug/L at the bottom. Maximum surface chlorophyll readings reached 17.1 ug/L, recorded on the afternoon of October 13th. Please note that tidal fluctuations and Blackstone River flows greatly influence water column salinity, temperature, and DO at this location.
Bullock Reach
Sondes were swapped for routine maintenance on October 12th. Overall, water quality was good at Bullock Reach this week. Salinity averaged 28.5 ppt, 30.1 ppt, and 30.7 ppt at the surface, middle, and bottom sondes, respectively. Surface salinity ranged 23.5 – 30.3 ppt, mid salinity ranged 27.2 – 31.1 ppt, and bottom salinity ranged 29.5 – 31.8 ppt. Temperatures decreased from the previous week. Surface temperature averaged 16.6°C and ranged from 14.9°C to 17.8°C. Mid temperatures averaged 16.7°C and ranged from 16.1°C to 17.4°C. Bottom temperatures averaged 16.5°C and ranged from 16.1°C to 17.1°C.
DO concentrations at Bullock Reach remained above the hypoxia threshold all week. Surface DO averaged 7.9 mg/L and ranged 7.1 – 10.4 mg/L. In the mid waters, DO averaged 7.5 mg/L and ranged 7.1 – 8.6 mg/L. At the bottom, DO averaged 7.3 mg/L and ranged 6.9– 7.8 mg/L. Chlorophyll concentrations were low all week. Overall, chlorophyll averaged 4.1 ug/L, 4.5 ug/L, and 3.4 ug/L at the surface, mid, and bottom waters, respectively. The maximum surface chlorophyll reading was 7.7 ug/L on October 12th.

