Historical News
Surface Mapping
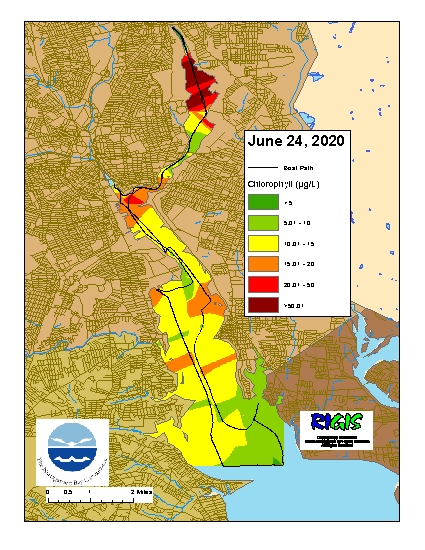
Data were collected on June 24, 2020 while the R/V Monitor was underway collecting bacteria samples in the Providence and Seekonk River estuaries. The chlorophyll concentrations were slightly variable and mostly fair with the exception of the Seekonk River which had poor chlorophyll concentration. From north to south, average chlorophyll concentrations were as follows: Seekonk River (19.61 µg/L), Upper Providence River (14.33 µg/L), Edgewood Shoals area (13.20 µg/L), Pawtuxet River area (13.01 µg/L ), and Lower Providence River area (8.84 µg/L ). Overall, chlorophyll ranged between 1.10 and 148.00 µg/L with an overall average of 15.18 µg/L. The chlorophyll data from this date are presented in the map below:
Bacteria Sampling
Twenty stations were sampled for fecal coliform bacteria in the Providence and Seekonk Rivers on June 10, 2020. Five of these stations were also sampled for enterococci bacteria. Conditions leading up to the June 10 sampling day were mostly dry, with 0.41 inches of rainfall recorded over the five days prior.
The geometric mean of fecal coliform results for all sites was 27 MPN/100 mL, with Seekonk River sites having higher counts than Providence River sites (geometric means of 87 and 15 MPN/100mL, respectively). The maximum count (930 MPN/100 mL) was measured at the Point Street Bridge site in the Providence River. The enterococci results ranged from <10 MPN/100 mL at Gaspee Point, Conimicut Point, and South FP East to 226 MPN/100 mL at Point St. Bridge, with an overall geometric mean of 22 MPN/100 mL. Both the Providence and Seekonk River had fecal coliform and enterococci results that exceeded state primary contact standards. Bacteria counts in both rivers also exceeded state shellfishing standards.
Please note: the results of NBC's fecal coliform and enterococci monitoring are for informational/research purposes only and are not to intended to suggest official state compliance with bathing or shellfishing standards.
Water Column Clarity
Water clarity was measured at seven locations in the Providence and Seekonk Rivers on June 17, 2020. In the three days prior to the survey there was no recorded precipitation, and water clarity decreased compared to the previous survey day. Overall, sites surveyed averaged 1.26 m Secchi depth, compared to 2.0 m on June 10. The lowest clarity (0.90 m) was measured at three sites; Phillipsdale Landing, India Point Park, and Ponham Rocks. While the greatest clarity was measured at Conimicut Point (1.90 m). Overall, a slight gradient of increasing clarity among the sites from north to south was observed.
Water Column Clarity
Water clarity was measured at seven locations in the Providence and Seekonk Rivers on June 10, 2020. In the three days prior to the survey there were no recorded precipitation, and water clarity increased compared to the previous survey day. Overall, sites surveyed averaged 2.0 m Secchi depth, compared to 1.79 m on May 28. The lowest clarity was measured at Phillipsdale Landing (1.50 m), while the greatest clarity was measured at Edgewood Yacht Club (2.30 m). Overall, a slight gradient of increasing clarity among the sites from north to south was observed.
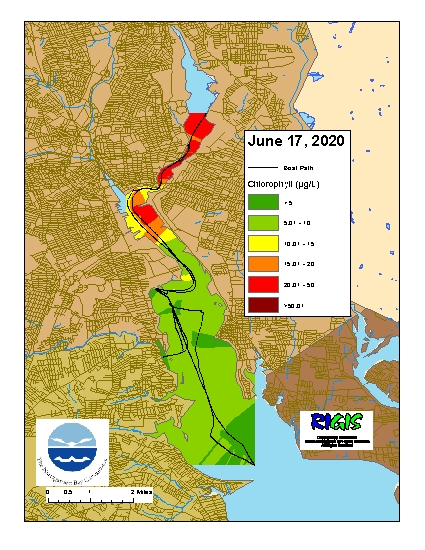
Surface Mapping
Data were collected on June 17, 2020 while the R/V Monitor was underway collecting nutrient samples in the Providence and Seekonk River estuaries. The chlorophyll concentrations were overall fair with poor conditions in the Seekonk and Upper Providence River. From north to south, average chlorophyll concentrations were as follows: Seekonk River (27.20 µg/L), Upper Providence River (10.95 µg/L), Edgewood Shoals area (6.21 µg/L), Pawtuxet River area (4.97 µg/L ), and Lower Providence River area (5.77 µg/L ). Overall, chlorophyll ranged between 2.10 and 70.60 µg/L with an overall average of 11.88 µg/L. The chlorophyll data from this date are presented in the map below: