Historical News
R/V Monitor's Blog
The R/V Monitor was out on the upper Bay twice this week. First, on Wednesday, September 2nd, the crew was out collecting bacteria samples, taking Secchi Disk and Par sensor water clarity measurements, conducting water column profiles using Seabird and sonde instruments, and conducting real-time surface mapping of water quality parameters, including dissolved oxygen, chlorophyll, water temperature, salinity, and pH, all in an effort to document water quality improvements associated with NBC construction projects. Jeff captained the boat while monitoring professionals Sara and Steve collected the samples and data. The day started cloudy and humid with calm waters. Light winds picked up out of the South and intermittent showers occurred by mid-morning. On Thursday, September 3rd, the crew serviced the mid-depth sonde on the Bullock's Reach Buoy. In addition, the temporary buoy in Pawtuxet Cove was serviced, as the sonde was changed out with a freshly calibrated sonde. The day started cloudy with rain showers. There was no wind and the water remained calm. The featured photo taken Wednesday while in the Seekonk River shows Osprey flying overhead.
Surface Mapping
Data
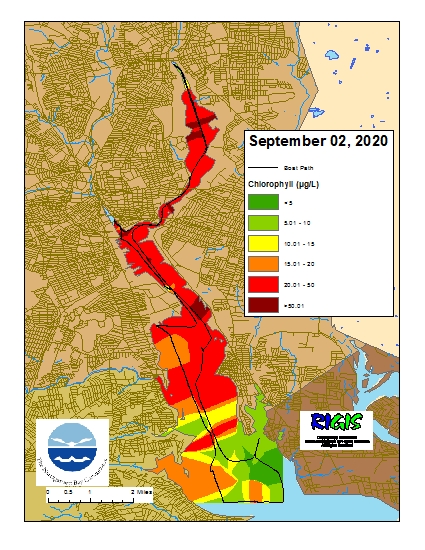
were collected on September 2, 2020 while the R/V Monitor was underway
collecting bacteria samples and performing vertical profiles in the Providence
and Seekonk River estuaries. The chlorophyll concentrations were variable from
poor to good in the areas surveyed with evidence of a north-south gradient. From
north to south, average chlorophyll concentrations were as follows: Seekonk
River (35.16 µg/L), Upper Providence River (34.65 µg/L), Edgewood Shoals area (21.17
µg/L), Pawtuxet River area (22.79 µg/L), and Lower Providence River area (13.87
µg/L). Overall, chlorophyll ranged between 3.10 µg/L and 187.50 µg/L with an
overall average of 27.18 µg/L. The chlorophyll data from this date are
presented in the map below:
Water Column Profiles
The NBC's Seabird profiling instrument was sent to the manufacturer for routine servicing over the winter; due to the COVID-19 pandemic, the return of the instrument has been greatly delayed. In the absence of this instrument, the NBC Environmental Monitoring Department has used a YSI EXO sonde to collect data on surface and bottom conditions at eight typical Seabird profiling sites on August 19. Settings on this instrument were not optimized for measurements of a true profile, rather, the goal was to obtain stable estimates of conditions at the surface and bottom only. These data are summarized here, and raw data are available upon request. In the five days prior to sampling, 0.5 inches of rainfall occurred. Stratification was present at most sites.
Salinities were highest at Conimicut Point, measuring 31.4 ppt at the surface and 32.2 ppt at the bottom. The lowest surface salinity (15.4 ppt) occurred at Pawtuxet Cove, while the lowest bottom salinity (27.7 ppt) was measured at India Point Park. Water temperatures were warmest at Point Street Bridge, ranging from 27.2°C at the surface to 27.0°C at the bottom. Surface waters were coolest at Bullock Reach, averaging 22.8°C, while bottom waters were coolest at Conimicut Point, averaging 21.6°C.
Dissolved oxygen (DO) concentrations were good this week; bottom waters at all sites remained above the hypoxia threshold (2.9 mg/L). Water column dissolved oxygen was lowest at Point Street Bridge, ranging from 4.7 mg/L in surface waters to 3.8 mg/L in bottom waters. The highest average surface DO (7.6 mg/L) was observed at Conimicut Point, while DO in bottom waters was greatest at Pawtuxet Cove (6.2 mg/L). Average surface chlorophyll ranged from 5.0 ug/L at Pomham Rocks to 24.5 ug/L at Bullock Reach; the maximum value recorded at Bullock Reach was 39.8 ug/L.
Water Column Clarity
Water clarity was measured at eight locations in the Providence and Seekonk Rivers on August 19, 2020. The weather leading up to the survey date was moderately wet, with 0.5 inches of rainfall recorded over the three days prior to sampling. Secchi depth increased at all sites compared to the previous survey, with an overall average of 1.95 m compared to 0.94 the week before. The greatest clarity, and greatest increase from the prior week was observed at Conimicut Point, where the Secchi depth of 3.70 m was substantially higher than 1.47 m measured on August 13. The lowest clarity overall was measured at Phillipsdale Landing at 1.10 m. A general gradient in increasing clarity from north to south was observed among sites this week.
Water Column Clarity
Water clarity was measured at eight locations in the Providence and Seekonk Rivers on August 13, 2020. The weather leading up to the survey date was dry, with just 0.01 inches of rainfall recorded the day before sampling and no rainfall over the four days prior to that. Average Secchi depth decreased by 0.46 m compared to the previous week, from 1.40 m to 0.94 m. All individual sites that were surveyed the previous week exhibited a decrease in clarity, the greatest of which was observed at Bullock Reach; clarity at this site declined from 1.90 m on August 5 to 0.77 m on August 13. The lowest clarity overall was measured at Edgewood Yacht Club at 0.30 m; the greatest clarity was observed at Conimicut Point at 1.47 m. There was no apparent gradient in clarity from north to south this week.

