Historical News
Water Column Clarity
Water clarity was measured using a Secchi disk at five locations in the Providence River estuary on April 26, 2017; sampling was unsuccessful at a sixth site, India Point Park, due to swift currents. Heavy rainfall of over 2 inches occurred the day before and the day of sampling, and a reduction in water clarity was evident. Secchi depth averaged 1.3 m over all sites, a decrease in clarity of 0.3 m since the previous survey date, April 19. Secchi depth was lowest, 1.1 m, at Pawtuxet Cove, a site just downstream of a major river input; this site exhibited the greatest decrease since the previous survey, 0.9 m. Clarity was highest, 1.7 m at Edgewood Yacht Club, which was unchanged from the previous week. There was no evidence of a clarity gradient up or down bay. In addition to Pawtuxet Cove, Pomham Rocks and Conimicut Point exhibited decreased clarity compared to the previous survey, while Bullock Reach exhibited a slight increase of 0.1 m.
Water Column Clarity
Water clarity was measured using a Secchi disk at six locations in the Providence and Seekonk River estuaries on April 19, 2017. The five days leading up to the survey date were generally dry, with less than 0.1 inches of precipitation measured at TF Green. Secchi depth averaged 1.7 m over all six sites, a slight increase in clarity of 0.1 m since the previous survey date, April 12. Secchi depth ranged from a minimum of 1.5 m at Bullock Reach and Conimicut Point to a maximum of 2.00 m at Phillipsdale Landing; this pattern is the opposite of the more typical gradient of increasing clarity with distance down bay. Five of the six sites exhibited increased clarity this week; the largest increase was observed at Edgewood Yacht Club, increasing by 0.5 m. Only Conimicut Point exhibited a decrease, by a minor 0.1 m.
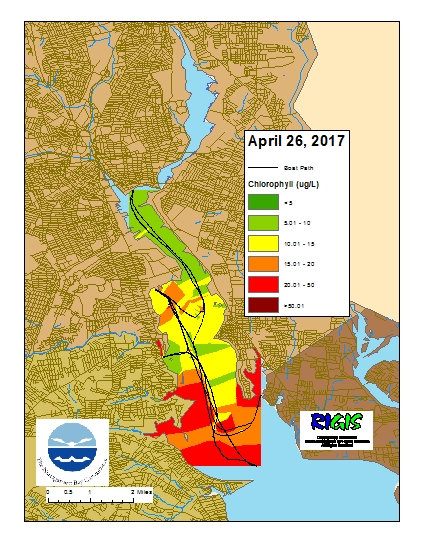
Surface Mapping
Data was collected on April 26, 2017 while the R/V Monitor was underway collecting nutrient samples and performing vertical profiles in the Providence River estuary. The chlorophyll concentrations were variable in areas surveyed with evidence of a north-south gradient. The lowest average chlorophyll concentrations were observed in the Upper Providence River (8.39 µg/l) and the Pawtuxet Cove Area (9.65 µg/l). The highest average concentrations were seen in the Edgewood Shoals Area (13.96 µg/l) and the Lower Providence River (19.85 µg/l). Overall, chlorophyll ranged between 4.3 and 296 µg/l with an overall average of 13.97 µg/l. The chlorophyll data from this date is presented in the map below:
R/V Monitor's Blog
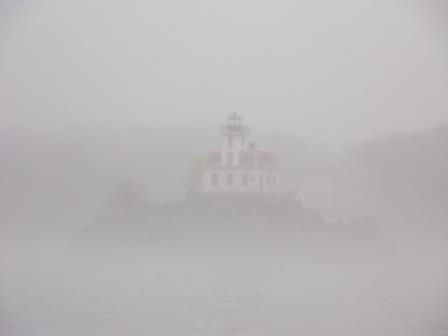
On Wednesday, April 26th, the crew of the R/V Monitor was out on the upper Bay collecting nutrients and plankton samples, taking Secchi Disk and Par sensor water clarity measurements, conducting water column profiles using the Seabird instrument, and conducting real-time surface mapping of water quality parameters, including dissolved oxygen, chlorophyll, water temperature, salinity, and pH, all in an effort to document water quality improvements associated with NBC construction projects. Jeffrey captained the boat while monitoring professionals Stephen and Amanda collected the samples and data. The weather was drizzley and foggy all day, and a light wind from the southeast made the waters a bit choppy. Pomham Rocks Lighthouse is barely visible through the thick fog in the photo below.
Phytoplankton Sampling
Phytoplankton samples were collected at Bullock’s Reach on March 29, 2017 and analyzed in the laboratory shortly after collection. It was a raw and cloudy day on Narragansett Bay with a light drizzle. Sonde data revealed the water temperature was 4.36oC, salinity was 26.62 ppt, and chlorophyll a concentration was 15.7 ug/L.
The plankton tow net sample was filterable with a 20 micron mesh. The filtrate was a thick, dark brown color with a greenish tint and medium filter-ability time. The tow net sample was analyzed qualitatively for microorganisms using 100x phase contrast microscopy. The whole water sample was analyzed quantitatively under 200x phase contrast microscopy. A Hensen Stempel pipette was used to accurately deliver 1ml of sample to a Sedge-wick Rafter chamber.
This analysis revealed a total of 6,536,000 cells per liter. In comparison to the last phytoplankton sampling from March 1, 2017, phytoplankton abundance decreased by over 1.5 million cells/L. The March 1st sampling date occurred during a phytoplankton bloom, and the abundance on March 29th remained well over the average Bullock’s Reach phytoplankton abundance.
The most predominant phytoplankton was Leptocylindrus at 3,344,000 cells/L. Leptocylindrus is a common Narragansett Bay chain-forming diatom. Other representative genera include the chain-forming diatoms Chaetoceros, Skeletonema, and Guinardia.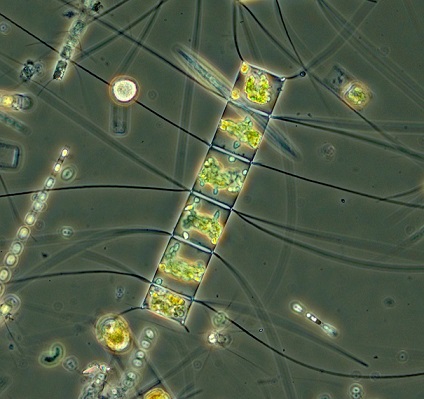
200x phase contrast micrograph of a Chaetoceros sp. chain. Six rectangular cells are visible. The long, thin processes that extend outwards from between the cells are made out of silica, and are called setae.
