Historical News
Bacteria Sampling
Nineteen stations were sampled for fecal coliform bacteria in the Providence and Seekonk River estuary on August 9th 2017. Five of these stations were also sampled for Enterococci bacteria. A total of 0.57 inches of rain fell during the five days prior to sampling; bacteria counts were relatively good throughout the estuary.
Overall, the fecal coliform geometric mean among all sites was 24 MPN/100 mL, a substantial decrease compared to the previous sampling date. Fecal coliform concentrations in the Seekonk River had a geometric mean of 57 MPN/100 mL, while results from the Providence River had a geometric mean of 16 MPN/100 mL. The maximum fecal coliform concentration of 430 MPN/100 mL was observed at the Point St. in the Providence River. Neither the Providence nor Seekonk River sites met state criteria for shellfishing, but the Providence River did meet primary contact criteria.
Four of the five sites sampled for Enterococci had results of less than the detection (10 MPN/100 mL). The only site to have detectable Enterococci concentrations was at Point Street Bridge with a concentration of 20 ug/L. The overall geometric mean for Enterococci was 11 MPN/100 mL. These results did meet state criteria for primary contact.
Please note: the results of NBC's fecal coliform and Enterococci monitoring are for informational/research purposes only and are not intended to suggest official state compliance with bathing or shellfishing standards.
Fixed Site Network
Phillipsdale
At Phillipsdale, sonde data revealed fair water quality conditions over the course of the week. There was very little rainfall during the week, only 0.20 inches. Surface and bottom salinities increased throughout the week. Surface salinity began the week mainly around 4.5 psu, but increased to an average of about 16 psu at weeks end, the overall average was 13.5 psu and ranged from 2.8 psu – 21.1 psu. Bottom salinity was affected by tidal fluctuations, though also exhibited an overall increase throughout the week and had an average salinity of 20.9 psu and a range of 8.6 psu – 26.2 psu. Surface and bottom temperatures were similar to last week with surface temperatures averaging 23.3oC and a range of 21.3oC – 25.5oC; bottom temperatures had an average of 22.9oC and ranged between 21.6oC – 25.0oC. Surface chlorophyll data had several erroneous values, but averaged 11.1 ug/L with those data removed. Dissolved oxygen (DO) for the week was fair at the surface and was hypoxic at the beginning of the week at the bottom. There were some instances of DO below 2.9 mg/L at the surface during the first few days of the week, but overall DO was fair with an average of 6.2 mg/L and a range of 2.0 mg/L – 14.3 mg/L and increased over the course of the week. Dissolved oxygen in the bottom waters had a weekly average of 3.3 mg/l and ranged from a minimum of 1.0 mg/L to a maximum of 11.6 mg/L. Rolling and daily averages of bottom DO showed nearly constant hypoxic conditions from the 6th – 8th, but increased DO above 2.9 mg/L from the 9th through the end of the week. Note that tidal fluctuations and Blackstone River flow greatly influence bottom DO, temperature and salinity at this location.
Bullocks Reach
Water quality at Bullocks Reach was good this week. There was a generally uniform water column from surface to bottom with little to no stratification evident. Temperatures were very similar this week to last week at each of the three depths with the surface water temperature averaging 23.2oC, mid water temperatures had an average of 22.4oC and bottom water temperatures averaged of 20.7oC. Surface, mid, and bottom salinities were relatively steady over the course of the week and averaged 25.6 psu, 27.7 psu, and 29.5 psu, respectively. Dissolved oxygen (DO) at all three depths increased slightly over the course of the week, but was overall lower than the previous week. There was hardly any incidence of hypoxia at any of the depths, except for a few values just below 2.9 mg/L at the bottom. Surface DO had a minimum of 3.4 mg/L, a maximum of 11.1 mg/L, and an average of 6.8 mg/L for the week. At the mid depth DO data showed good conditions with an average of 5.6 mg/L, a minimum of 3.6 mg/L and a maximum of 8.6 mg/L. The average weekly bottom DO was 3.6 mg/L and ranged between 2.6 mg/L to 5.4 mg/L. Surface chlorophyll declined through the week and was lower than last week; a peaked of about 16.5 ug/L occurred on the 8th with a weekly average of 10.6 ug/L; mid chlorophyll also peaked on the 8th at about 12 ug/L, with a weekly average of 8.0 ug/L.
R/V Monitor's Blog
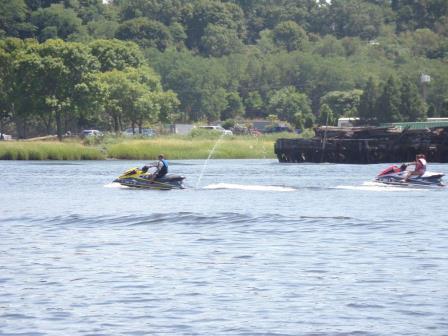
On Thursday, August 17th, the crew of the R/V Monitor was out on the upper Bay collecting nutrients and plankton samples, taking Secchi Disk and Par sensor water clarity measurements, conducting water column profiles using the Seabird instrument, and conducting real-time surface mapping of water quality parameters, including dissolved oxygen, chlorophyll, water temperature, salinity, and pH, all in an effort to document water quality improvements associated with NBC construction projects. Sara captained the boat while monitoring professional Steve collected the samples and data. Environmental scientist Eliza was also aboard to review and evaluate sampling activities.It was a warm sunny day with a slight breeze and very calm waters. The below photo taken this fine summer day features people operating watercraft at India Point Park.
R/V Monitor's Blog
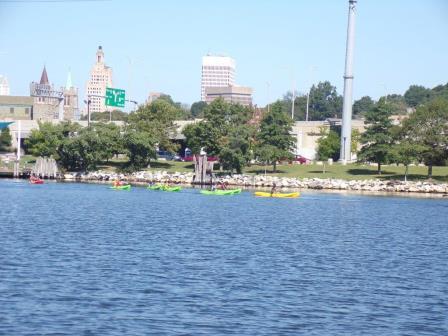
On Wednesday, August 9th, the crew of the R/V Monitor was out on the upper Bay collecting bacteria samples, taking Secchi Disk and Par sensor water clarity measurements, conducting water column profiles using the Seabird instrument, and conducting real-time surface mapping of water quality parameters, including dissolved oxygen, chlorophyll, water temperature, salinity and pH, all in an effort to document water quality improvements associated with NBC construction projects. Jeff captained the boat in the morning, and Sara captained the boat in the afternoon, and each assisted monitoring professional Mike collect the samples and data when they were not captaining. It was a beautiful sunny day out on the bay, with a cool air temperature and no wind in the morning, turning warmer in the afternoon with the development of a light breeze from the south. The water remained calm all day. The photo below showing kayakers enjoying this fine summer day was taken at India Point Park.
Nutrients Sampling
Fourteen river stations and eight bay stations were sampled for nutrients on July 6, 2017. Each of the bay stations was sampled at the surface, and one station (Edgewood Shoals) was also sampled at the bottom. The five days prior to sampling were dry, with only trace rainfall recorded at TF Green. Among the river stations, the lowest total nitrogen (TN) and dissolved inorganic nitrogen (DIN) concentrations were observed at the Warren Reservoir/Kickemuit River site, at 951 ppb and 18.8 pbb, respectively. The lowest total dissolved nitrogen (TDN) was observed on the Palmer River at Rt. 6, at 429 ppb. The highest nitrogen concentrations were measured on the Taunton River at Berkley Bridge (1830 ppb TN; 1590 ppb TDN; 1147 ppb DIN).
Among the surface bay stations, TN ranged from 1400 ppb at Phillipsdale Landing to 644 ppb at Conimicut Point, generally following a north to south gradient in decreasing concentration. TDN and DIN were also highest at Phillipsdale Landing (924 ppb and 688 ppb, respectively). TDN was lowest at Conimicut Point (183 ppb), while DIN was lowest at Edgewood Yacht Club (24.3 ppb). Chlorophyll a ranged from 3.5 µg/L at Conimicut Point to a maximum of 52.2 µg/L at Edgewood Yacht Club. Pomham Rocks had similarly high (above 25 µg/L) chlorophyll concentrations, indicative of a phytoplankton bloom in the middle of the survey region. Overall, chlorophyll a averaged 16.1 µg/L, which was an decrease from the large bloom observed during the previous survey week.
Results from nutrient sampling completed on July 19 and August 2 are pending analysis from the NBC Laboratory. The next anticipated nutrients sampling data is August 16.
