Historical News
Nutrients Sampling
Seven river stations and seven bay stations were sampled for nutrients on August 17th 2017. Each of the bay stations was sampled at the surface and at the bottom. In the five days prior to sampling there was 0.19 inches of rainfall recorded at TF Green. Among the river stations, the highest nitrogen concentrations for total nitrogen (TN), total dissolved nitrogen (TDN) and dissolved inorganic nitrogen (DIN) were measured on the Pawtuxet River with 1,795 ppb for TN, 1,700 ppb for TDN, and 1,422 ppb DIN. The lowest TN and TDN were observed on the Moshassuck River at Higginson Ave. at 513 ppb for TN and 394 ppb for (TDN); the lowest DIN was observed at the Ten Mile River at Omega Pond site at 107 ppb.
Among the surface bay stations, the highest nutrients concentrations were found at the Pawtuxet Cove, where the Pawtuxet River enters the bay. TN measured 1,230 ppb, TDN 770 ppb and DIN 532 ppb at Pawtuxet Cove. Total Nitrogen (TN) was lowest at Conimicut Point with 637 ppb; the lowest TDN was measured at Edgewood Yacht Club with 217 ppb, and the lowest DIN was measured at Phillipsdale Landing with 13 ppb. Chlorophyll a was generally elevated at all locations andranged from 3.1 µg/L at Edgewood Yacht Club to a maximum of 60.6 µg/L at Phillipsdale Landing. Overall, chlorophyll a averaged 22.6 µg/L, with the highest chlorophyll in the upper Providence River and Seekonk River.
Results from nutrient sampling completed on August 30 and September are pending analysis from the NBC Laboratory. The next anticipated nutrients sampling data is October 11th.
Nutrients Sampling
Fourteen river stations and seven bay stations were sampled for nutrients at the surface and an additional bay station was sampled at the surface at bottom on August 2nd, 2017. Each of the bay stations was sampled at the surface and at the bottom. The five days prior to sampling were dry, with only trace rainfall recorded at TF Green. Among the river stations, the lowest total nitrogen (TN) was observed on the Moshassuck River at Higginson Ave. at 531 ppb; the lowest total dissolved nitrogen (TDN) was observed at th Ten Mile River at Omega Pond site at 405 ppb; and the lowest dissolved inorganic nitrogen (DIN) was observed at the Warren Resovior/Kickemuit River site at <13 ppb. The highest nitrogen concentrations for TDN and DIN were measured on the Ten Mile River at Central Ave with 1,590 ppb for TDN and 1,280 ppb DIN; the highest TN was measured at the Taunton River with 1,890.
Among the surface bay stations, TN ranged from 1,650 ppb at Phillipsdale Landing to 718 ppb at Conimicut Point, generally following a north to south gradient of decreasing concentration. TDN and DIN were highest at Pawtuxet Cove (1,020 ppb and 635 ppb, respectively). TDN was lowest at Edgewood Yacht Club with 186 ppb and DIN was lowest at Pomham Rocks with a concentration of 24 ppb. DIN was generally low with many sites below 30 ppb.
Chlorophyll a was generally elevated at all locations andranged from 9.9 µg/L at Conimicut Point to a maximum of 111.1 µg/L at Pomham Rocks. Edgewood Yacht Club had similarly high (above 25 µg/L) chlorophyll concentrations, indicative of a phytoplankton bloom in the middle of the survey region. Overall, chlorophyll a averaged 42.8 µg/L, indicating chlorophyll blooms around much of the upper bay.
Results from nutrient sampling completed on August 17 and August 30 are pending analysis from the NBC Laboratory. The next anticipated nutrients sampling data is September 13th.
R/V Monitor's Blog
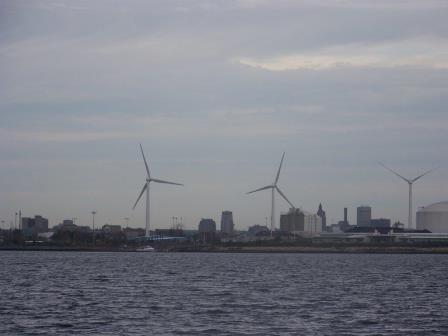
On Wednesday, October 11th, the crew of the R/V Monitor was out on the upper Bay collecting nutrients and plankton samples, taking Secchi Disk and Par sensor water clarity measurements, conducting water column profiles using the Seabird instrument, and conducting real-time surface mapping of water quality parameters, including dissolved oxygen, chlorophyll, water temperature, salinity, and pH, all in an effort to document water quality improvements associated with NBC construction projects. Sara captained the boat, while monitoring professionals Steve, Mike and Fern collected the samples and data. It was a cloudy to partly cloudy mild day with a light wind out of the west. The water had a slight chop to it. The photo below was taken at Field's Point. NBC's three wind turbines are visible in the background.
Bacteria Sampling
Twenty stations were sampled for fecal coliform bacteria in the Providence and Seekonk Rivers on October 4, 2017. Five of these stations were also sampled for Enterococci bacteria. A total of 1.21 inches of rain fell four days prior to sampling, though the next three days were dry.
Despite the rainfall, overall bacteria counts were down from the previous survey. The fecal coliform geometric mean for both rivers was 15 MPN/100 mL, a substantial improvement over the previous survey on September 7 (though note that survey followed more substantial rainfall). Fecal coliform concentrations were higher in the Seekonk River, where a geometric mean of 71 MPN/100 mL was observed, compared to the Providence River, which had a geometric mean of 7 MPN/100 mL. The maximum fecal coliform concentration of 430 MPN/100 mL was observed at Point St. Bridge, where the Providence River flows from the city. Fecal coliform concentrations in the Seekonk River exceeded state criteria for primary contact and shellfishing, though results in the Providence River did not.
Enterococci counts in the Providence and Seekonk Rivers ranged from <10 MPN/100 mL at most sites to 85 MPN/100 mL at Point St. Bridge. The overall geometric mean for Enterococci was 17 MPN/100 mL. These results are within state criteria for primary contact.
Please note: the results of NBC's fecal coliform and Enterococci monitoring are for informational/research purposes only and are not intended to suggest official state compliance with bathing or shellfishing standards.
Water Column Clarity
Water clarity was measured at six locations in the Providence and Seekonk Rivers on October 11, 2017. A total of 0.4 inches of rainfall was recorded in the region over the three days prior to the survey, but overall clarity continued to improve this week. Secchi depth increased at all sites from the previous week, ranging from 2.6 meters at Pawtuxet Cove to 2.8 m at the remaining sites. The average water clarity was 2.8 m, 0.6 m greater than last week; the greatest increase, 1.1 m, was observed at Pomham Rocks. Overall, there was no evidence of a north to south gradient in water clarity this week.
