Historical News
Water Column Clarity
Water clarity was measured at eight locations in the Providence and Seekonk Rivers on July 18, 2018. There was 0.59 inches of rain the day prior to sampling. Overall, average clarity increased from the previous week by 0.5 m, to 1.8 m. The largest increase (1.67 m) was observed at India Point Park. Secchi depth ranged from 0.77 m at Phillipsdale Landing to 3.10 m at India Point Park. There was no evidence of a north to south water clarity gradient.
Surface Mapping
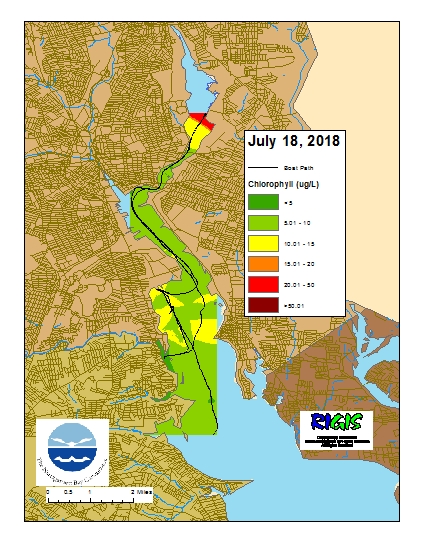
Data was collected on July 18, 2018 while the R/V Monitor was underway collecting nutrient samples and performing vertical profiles in the Providence and Seekonk River estuaries. The chlorophyll concentrations were fair in areas surveyed. From north to south, average chlorophyll concentrations were as follows: Seekonk River (13.29 µg/l), Upper Providence River (7.29 µg/l), Edgewood Shoals area (10.59 µg/l), Pawtuxet River area (5.74 µg/l), and the Lower Providence River (6.62 µg/l). Overall, chlorophyll ranged between 1.10 µg/l and 49.00 µg/l with an overall average of 8.85 µg/l. The chlorophyll data from this date is presented in the map below:
Fixed Site Network
Phillipsdale
This week at Phillipsdale, data revealed overall good water quality, with some slight stratification observed at the end of the week. There was minimal rainfall over the course of the week, with decreasing flow from the Blackstone River until July 6th. Surface salinities were mainly above 10 ppt, with an overall average for the week was of 9.7 ppt, a minimum of 3.6 ppt, and a maximum of 15.1 ppt. Bottom salinity was relatively stable and fluctuated with the tides over the course of the week and had an average of 22.5 ppt and a range 10.2 ppt – 31.8 ppt. Surface and bottom temperatures had increased by about 3-4oC on average compared to the prior week. The average surface temperature was 26.4oC and had a range of 22.1oC – 30.6oC; bottom temperatures had a weekly average of 23.5oC and a range of 20.2oC – 28.7oC. Surface chlorophyll was quite elevated over th week and had a weekly average of 26.6 ug/L, and a daily average peak of about 40.0 ug/L. Dissolved oxygen (DO) for the week was good at the surface and relatively poor at the bottom. Surface DO increased as compared to the previous week and averaged 9.6 mg/L and had a minimum of 4.3 mg/L. Dissolved oxygen in the bottom waters had some extended durations of hypoxia (below 2.9 mg/L) and had a weekly average of 3.2 mg/l and a minimum of 0.8 mg/L, with two days during the week of daily average DO below 2.9 mg/L on the 5th and 7th. Note that tidal fluctuations and Blackstone River flow greatly influence bottom DO, temperature and salinity at this location.
Bullock's Reach
The Bullock’s Reach sondes data revealed fair to good water quality conditions over the week, with some slight stratification observed between the surface/mid and bottom sondes. Some hypoxia was noted during the week particularly at the bottom. Temperatures at all three depths had increased this week by about 4oC at the surface, 3oC at the mid-depth, and about 1oC at the bottom. Temperatures at the surface, mid, and bottom depths had weekly averages of 25.5oC, 23.2oC, and 19.6oC, respectively. Salinities at all three depths were relatively stable, with some slight decrease over the week observed at ll three depths; surface salinity averaged 24.6 ppt, mid-depth averaged 28.1 ppt, and bottom salinity averaged 30.3. Surface chlorophyll increased while mid-depth chlorophyll was very similar to last week; chlorophyll averaged 17.3 ug/L with a daily maximum average peak of about 26 ug/L on the 5th. Mid-depth chlorophyll averaged 10.6 ug/L for the week. Dissolved oxygen (DO) was good at the surface and fair at the mid and bottom depths, with both of these depths experiencing some hypoxia over the week. Surface DO averaged 9.1 mg/L with a minimum of 5.4 mg/L; mid-depth DO averaged 5.4 mg/L and had a minimum of 2.8 mg/L. There were some extended periods of hypoxia at the bottom, with DO averaging of 3.6 mg/L for the week, a minimum of 1.9 mg/L, and also had one day of the week with daily average of 2.4 mg/L on the 6th.
Fixed Site Network
Phillipsdale
This week at Phillipsdale, data revealed overall good water quality, with some slight stratification observed at the end of the week. Over the course of the week there was 1.44 inches of rainfall, all falling on the 28th, increasing flow from the Blackstone River substantially. Surface salinities were mainly above 15 ppt, until the 28th when salinity decreased to around less than 10 ppt; the overall average for the week was of 14.6 ppt, a minimum of 2.7 ppt, and a maximum of 23.3 ppt. Bottom salinity was relatively stable and fluctuated with the tides over the course of the week and had an average of 23.6 ppt and a range 10.8 ppt – 30.0 ppt. Surface and bottom temperatures had a slight increase, but were overall stable as compared to the prior week. The average surface temperature was 22.2oC and had a range of 18.6oC – 23.0oC; bottom temperatures had a weekly average of 20.8oC and a range of 18.7oC – 23.9oC. Surface chlorophyll decreased over the course of the week and had a weekly average of 9.5ug/L, and a daily average peak of about 15.0 ug/L. Dissolved oxygen (DO) for the week was good at the surface and fair at the bottom. Surface DO decreased as compared to the previous week and averaged 6.1 mg/L and had a minimum of 3.0 mg/L. Dissolved oxygen in the bottom waters had some short durations of hypoxia (below 2.9 mg/L) and had a weekly average of 3.7 mg/l and a minimum of 2.0 mg/L. Note that tidal fluctuations and Blackstone River flow greatly influence bottom DO, temperature and salinity at this location.
Bullock's Reach
The Bullock’s Reach sondes data revealed good water quality conditions over the week, with some slight stratification observed between the surface and mid/bottom sondes towards the end of the week. There were no instances of hypoxia observed. Temperatures at all three depths had some increase this week, though surface temperatures had the largest increase. Temperatures at the surface, mid, and bottom depths had weekly averages of 21.3oC, 20.2oC, and 18.7oC, respectively. Salinities at all three depths were relatively stable, with some slight decrease over the week observed at the surface and bottom; surface salinity averaged 26.8 ppt, mid-depth averaged 28.8 ppt, and bottom salinity averaged 30.6. Chlorophyll decreased at the surface but showed an increase at mid-depth; both depths but had very similar weekly measurements of 10.9 ug/L and the surface and 10.5 ug/L at the mid-depth. Dissolved oxygen (DO) at the three depths was good, with a slight decrease as compared to last week. Surface DO averaged 7.8 mg/L with a minimum of 5.8 mg/L; mid-depth DO averaged 6.2 mg/L and had a minimum of 4.1 mg/L. Bottom DO was also fair to good with a weekly average of 5.1 mg/L and a minimum of 4.1 mg/L.
R/V Monitor's Blog
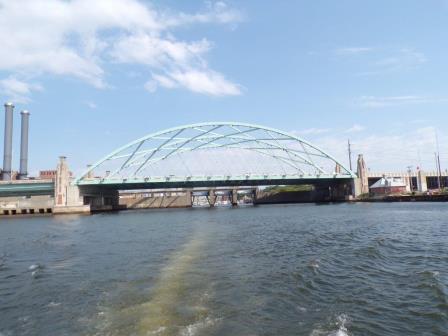
On Wednesday, July 11th, the crew of the R/V Monitor was out on the upper Bay collecting bacteria samples, taking Secchi Disk and Par sensor water clarity measurements, conducting water column profiles using the Seabird instrument, and conducting real-time surface mapping of water quality parameters, including dissolved oxygen, chlorophyll, water temperature, salinity and pH, all in an effort to document water quality improvements associated with NBC construction projects. Jeff captained the boat while monitoring professionals Sara and Heather collected the samples and data. Summer intern Nick assisted with the sample and data collection as well. It was a sunny and warm day with a light breeze and calm waters. The photo taken this day shows the Interstate 195 Iway bridge and Providence hurricane barrier as viewed from the south.