Historical News
Water Column Clarity
Water clarity was measured at nine locations in the Providence and Seekonk Rivers on September 19, 2018. There was 0.53 inches of precipitation in the two days prior to sampling. Overall, average water clarity decreased as compared to the previous week from 2.4 m to 1.7 m, and was shown to have decreased at all sites that were measured in both weeks. The largest decrease of 1.50 m occurred at Bullock Reach. Secchi depth ranged from 1.2 m at India Point to 2.1 m at Bullock Reach. There was not a strong north to south gradient in water clarity observed on this day.
Bacteria Sampling
Twenty stations were sampled for fecal coliform bacteria in the Providence and Seekonk Rivers on August 22, 2018. Approximately one inch of precipitation was recorded in the five days prior to sampling, while 0.3 inches of rainfall occurred the morning of sampling.
Fecal coliform geometric mean increased from the previous sampling to 292 MPN/100 mL. The fecal coliform geomean was higher in the Seekonk River (15,997 MPN/100 mL) compared to the Providence River (45 MPN/100 mL). The maximum fecal coliform concentration (240,000 MPN/100 mL) was measured at Point Street Bridge in the Providence River. Fecal coliform concentration results in both rivers were above state guidelines for primary contact.
The Enterococci geometric mean for the Seekonk and Providence Rivers increased from the previous sampling to 114 MPN/100 mL. Enterococci concentrations ranged from below detection at three stations to 11,199 MPN/100 mL at Point Street Bridge. These results are not within the state criteria for primary contact.
Please note: the results of NBC's fecal coliform and Enterococci monitoring are for informational/research purposes only and are not intended to suggest official state compliance with bathing or shellfishing standards.
Fixed Site Network
Phillipsdale
This week at Phillipsdale, data revealed fair to poor water quality. There was 0.54 inches of rainfall during the week falling mostly on the 18th; this rainfall increased flow from the Blackstone River again which was already high from rainfall the week prior. Surface salinity was low and remained below 7 ppt for much of the week; surface salinity averaged 4.4 ppt and ranged from 1.9 – 10.5 ppt. Bottom salinity also decreased and was highly variable throughout the week, bottom salinity had an average of 17.4 ppt and a range 3.4 ppt – 27.7 ppt. Surface and bottom temperatures were similar to each other, and were similar to last week’s overall temperatures. Surface temperature averaged 21.7oC with a range of 19.4oC – 25.0oC; bottom temperatures also had a weekly average of 21.7oC and a range of 20.4oC – 22.9oC. Surface chlorophyll decreased substantially throughout the week and had a weekly average of 4.8 ug/L, and a daily average peak of about 6 ug/L on the 11th. Dissolved oxygen (DO) for the week was good at the surface and relatively poor at the bottom. Surface DO had a weekly average was 7.3 mg/L with a minimum of 4.4 mg/L. Dissolved oxygen in the bottom waters was similar to last week, though there were still extended periods of hypoxia almost daily. The weekly average for bottom DO was 3.1 mg/l and a minimum of 0.7 mg/L; the 17th and 18th both had daily averages below 2.9 mg/L. Note that tidal fluctuations and Blackstone River flow greatly influence bottom DO, temperature and salinity at this location.
Bullock Reach
The Bullock’s Reach sondes data revealed good to fair water quality conditions over the week, with a relatively well mixed water column, until surface salinity decreased on the 19th . Temperatures at all three depths were quite similar and had a slight increase; temperatures averaged 22.3oC at the surface, 21.9oC at the mid, and 21.4oC at the bottom. Salinities were relatively stable at the mid and bottom depth, but was quite variable at the surface; rainfall on the 18th decreased surface salnity. Average surface salinity was 24.2 ppt, a mid-depth salinity averaged of 29.7 ppt, and bottom salinity averaged 31.7 ppt. Chlorophyll at the surface was still elevated at the beginning of the week but decreased after the 18th. Surface chlorophyll peaked at about 34.0 ug/L on the 17th and averaged 16.1 ug/L for the week; mid chlorophyll averaged 7.3 ug/L, and bottom chlorophyll averaged 3.0 ug/L. Dissolved oxygen (DO) was fair to good at all three depths with minimal hypoxia observed at the bottom depth. Surface DO averaged 7.4 mg/L with a minimum of 5.3 mg/L; mid-depth DO averaged 5.2 mg/L and a minimum of 3.7 mg/L. Bottom DO was fair as compared to the previous week with a weekly bottom DO average of 4.4 mg/L, with a minimum of 2.6 mg/L.
Fixed Site Network
Phillipsdale
This week at Phillipsdale, data revealed fair to poor water quality. There was 2.46 inches of rainfall during the week from the 10th – 13th, which increased flow from the Blackstone River substantially. Surface salinity decreased from about 25 ppt to about 6 ppt over the course of the week with an average of 15.9 ppt. Bottom salinity also decreased and had an average of 23.8 ppt and a range 10.1 ppt – 29.1 ppt. Surface and bottom temperatures were similar to each other, but decreased by 2-4oC, with bottom waters being overall warmer than surface waters. Surface temperature averaged 21.6oC with a range of 20.0oC – 24.4oC; bottom temperatures had a weekly average of 22.1oC and a range of 20.7oC – 23.2oC. Surface chlorophyll decreased substantially throughout the week and had a weekly average of 9.5 ug/L, and a daily average peak of about 18 ug/L on the 11th. Dissolved oxygen (DO) for the week was fair at the surface and relatively poor at the bottom. Surface DO had a weekly average was 4.6 mg/L with a minimum of 2.3 mg/L. Dissolved oxygen in the bottom waters was similar to last week, though there were still extended periods of hypoxia almost daily. The weekly average for bottom DO was 3.0 mg/l and a minimum of 2.1 mg/L; the 12th and 13th both had daily averages below 2.9 mg/L. Note that tidal fluctuations and Blackstone River flow greatly influence bottom DO, temperature and salinity at this location.
Bullock's Reach
The Bullock’s Reach sondes data revealed good to fair water quality conditions over the week, with a relatively well mixed water column, until surface salinity decreased on the 12th . Temperatures at all three depths were quite similar had an overall decrease of about 1- 3.5oC; temperatures averaged 21.9oC at the surface, 21.6oC at the mid, and 21.5oC at the bottom. Salinities increased slightly throughout the week at the mid depth and bottom, but decreased at the surface by about 4 ppt through the week; average surface salinity was 26.8 ppt, a mid-depth salinity averaged of 29.6 ppt, and bottom salinity averaged 30.9 ppt. Chlorophyll at the surface was still elevated and also began in increase towards the end of the week above the 10 ug/L range; surface chlorophyll peaked at about 14.0 ug/L on the 15th and averaged 8.8 ug/L for the week; mid chlorophyll averaged 4.2 ug/L, and bottom chlorophyll averaged 4.1 ug/L. Dissolved oxygen (DO) was fair at all three depths with no hypoxia observed at any depth. Surface DO averaged 5.4 mg/L with a minimum of 4.0 mg/L; mid-depth DO averaged 5.0 mg/L and a minimum of 4.1 mg/L. Bottom DO was much improved as compared to the previous few weeks with a weekly bottom DO average of 4.8 mg/L, with a minimum of 3.8 mg/L.
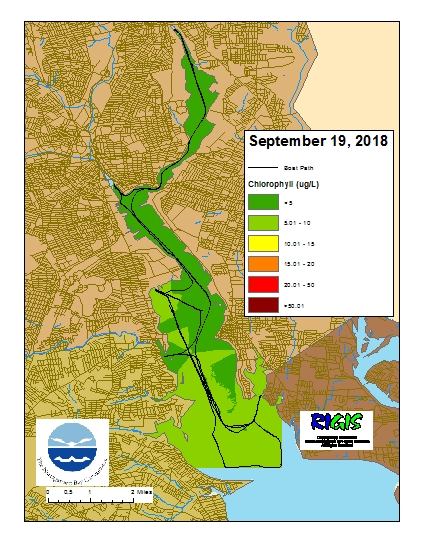
Surface Mapping
Data was collected on September 19, 2018 while the R/V Monitor was underway collecting bacteria samples and performing vertical profiles in the Providence and Seekonk River estuaries. The chlorophyll concentrations were mostly low in areas surveyed. From north to south, average chlorophyll concentrations were as follows: Seekonk River (3.32 µg/l), Upper Providence River (2.95 µg/l), Edgewood Shoals area (5.53 µg/l), Pawtuxet River area (4.57 µg/l), and the Lower Providence River (6.99 µg/l). Overall, chlorophyll ranged between 1.10 µg/l and 10.80 µg/l with an overall average of 4.78 µg/l. The chlorophyll data from this date is presented in the map below: