Historical News
R/V Monitor's Blog
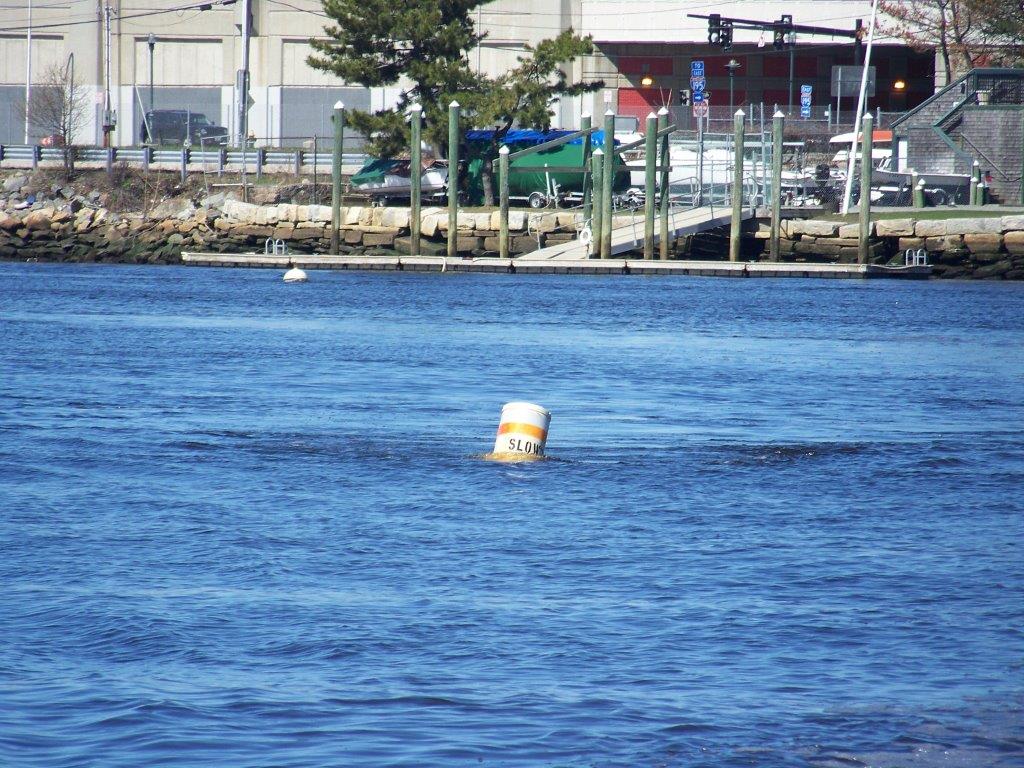
On Wednesday, April 17th, the crew of the R/V Monitor was out on the upper Bay collecting bacteria samples in an effort to document water quality improvements associated with NBC construction projects. Water clarity measurements, water column profiles, and real-time surface mapping of water quality parameters were not done this day due to time constraints and equipment issues. Jeff captained the boat while monitoring professionals Sara, Amanda and Michael collected the samples and data. It was a sunny and cool day with a calm wind, and slightly choppy waters. The featured photo was taken at the Community Boating Center at India Point Park.
Nutrients Sampling
Fourteen river stations were sampled for nutrients on February 27, 2019. Three days prior to sampling, 0.87 inches of rainfall occurred. Highest total nitrogen (TN), total dissolved nitrogen (TDN), and dissolved inorganic nitrogen (DIN) occurred at the Ten Mile River at Central Avenue site, with concentrations of 1940 ppb, 1940 ppb, and 1792 ppb, respectively. Lowest nitrogen concentrations were measured at the Coles River at Milford Street site; TN was 588 ppb, TDN was 434 ppb, and DIN was 241 ppb. Results from nutrient sampling completed on March 13, March 27, and April 10 are pending final analysis. The next anticipated date of sampling is April 24, 2019.
Fixed Site Network
Phillipsdale
This week at Phillipsdale, sonde data revealed good water quality. There was about 1.82 inches of rainfall, causing riverflow from the Blackstone River to increase this week. This high riverflow caused surface and bottom salinity to decrease over the course of the week. Overall, surface salinity averaged 5.0 psu, with a minimum of 1.4 psu, and a maximum of 11.5 psu. Bottom salinity fluctuated with the tides, and had a weekly average of 10.2 psu and there was a range of 8.4 psu – 12.4 psu. Both surface temperatures and bottom temperatures decreased slightly; surface temperatures averaged 10.0oC with a range of 7.5oC – 12.7oC; bottom temperatures had an average of 8.7oC and ranged between 6.6oC – 11.9oC. Dissolved oxygen (DO) for the week was very good at both the surface and the bottom; surface DO had an average of 11.1 mg/L and a range of 10.2 mg/L – 12.2 mg/L. Dissolved oxygen in the bottom waters had a weekly average of 10.2 mg/l and ranged from a minimum of 8.4 mg/L to a maximum of 12.4 mg/L. Chlorophyll was low this week with a weekly average of about 1.2 ug/L at both surface and bottom depths. Note that tidal fluctuations and Blackstone River flow greatly influence bottom DO, temperature and salinity at this location.
Bullock Reach
The buoy and sondes at Bullock Reach are currently out of the water for the season.
Water Column Profiles
Water Column Profiles
Water column profiles were measured at six sites in the Seekonk and Providence River estuaries on March 13, 2019. Moderate rainfall of 0.64 inches was recorded in the area three days prior to sampling, and continued snowmelt contributed to a low salinity surface layer observed at Pawtuxet Cove, the site closest to a river source. Salinity at the surface at this site was around 6 psu. Surface salinity at the remaining five sites ranged from 22 psu to 25 psu. Bottom salinity was also lowest at Pawtuxet Cove, at 26 psu, compared to a maximum bottom salinity of 30 psu at Bullock Reach and Conimicut Point. Density stratification related to temperature and salinity was observed at most sites. The maximum water temperature this week was 5.6°C at the surface at India Point Park, while the minimum of 3.5°C was observed at the bottom at India Point Park and near-surface at Conimicut Point and Bullock Reach. Dissolved oxygen (DO) levels were high at all sites, remaining well above the hypoxia threshold of 2.9 mg/L; the minimum DO of 9.3 mg/L was measured in the bottom waters of Bullock Reach. Unfortunately, fluorescence data collected this week appeared suspect and were deemed non-reportable.
