Historical News
Water Column Clarity
Water clarity increased at India Point Park, Pomham Rocks, and Edgewood Yacht Club. Water clarity decreased at Pawtuxet Cove, Bullock Reach, and Conimicut Point. The largest increase in clarity, 0.93 m, occurred at Pomham Rocks. Secchi depth ranged from 1.07 m at Phillipsdale Landing to 3.43 m at Pomham Rocks. A north to south water clarity gradient was not observed.
Fixed Site Network
Phillipsdale
This week at Phillipsdale, sonde data revealed good water quality. There was about 0.87 inches of rainfall, mostly at the beginning of the week, and above average but decreasing riverflow from the Blackstone River. Overall, surface salinity decreased slightly this week, and remained mostly under 10 psu for the entire week; the average surface salinity was 3.9 psu with a minimum of 0.9 psu, and a maximum of 10.2 psu. Bottom salinity fluctuated with the tides and had an average of 14.4 psu and a range of 1.1 psu – 29.6 psu. Surface and bottom temperatures increased on average by about 3 – 4.0oC over the week with surface temperatures averaging 14.5oC with a range of 11.9oC – 17.6oC; bottom temperatures had an average of 12.9oC and ranged between 9.7oC – 16.9oC. Dissolved oxygen (DO) for the week was very good at both the surface and the bottom; surface DO had an average of 9.1 mg/L and a range of 8.1 mg/L – 9.8 mg/L. Dissolved oxygen in the bottom waters had a weekly average of 7.7 mg/l and ranged from a minimum of 6.2 mg/L to a maximum of 9.6 mg/L. Chlorophyll was very low this week with a weekly average of 0.7 ug/L. Note that tidal fluctuations and Blackstone River flow greatly influence bottom DO, temperature and salinity at this location.
Bullock Reach
The buoy at Bullock Reach was deployed on May 9. It is anticipated that the sondes will be deployed at the buoy the week of May 19th.
Surface Mapping
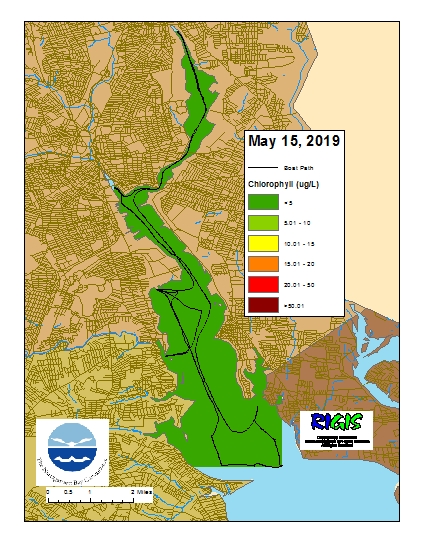
Data was collected on May 15, 2019 while the R/V Monitor was underway collecting bacteria samples and performing vertical profiles in the Providence and Seekonk River estuaries. The chlorophyll concentrations were low in areas surveyed. From north to south, average chlorophyll concentrations were as follows: Seekonk River (2.46 µg/l), Upper Providence River (1.97 µg/l), Edgewood Shoals area (2.60 µg/l), Pawtuxet River area (2.17 µg/l), and the Lower Providence River (2.34 µg/l). Overall, chlorophyll ranged between non-detectable and 5.90 µg/l with an overall average of 2.30 µg/l. The chlorophyll data from this date is presented in the map below:
R/V Monitor's Blog
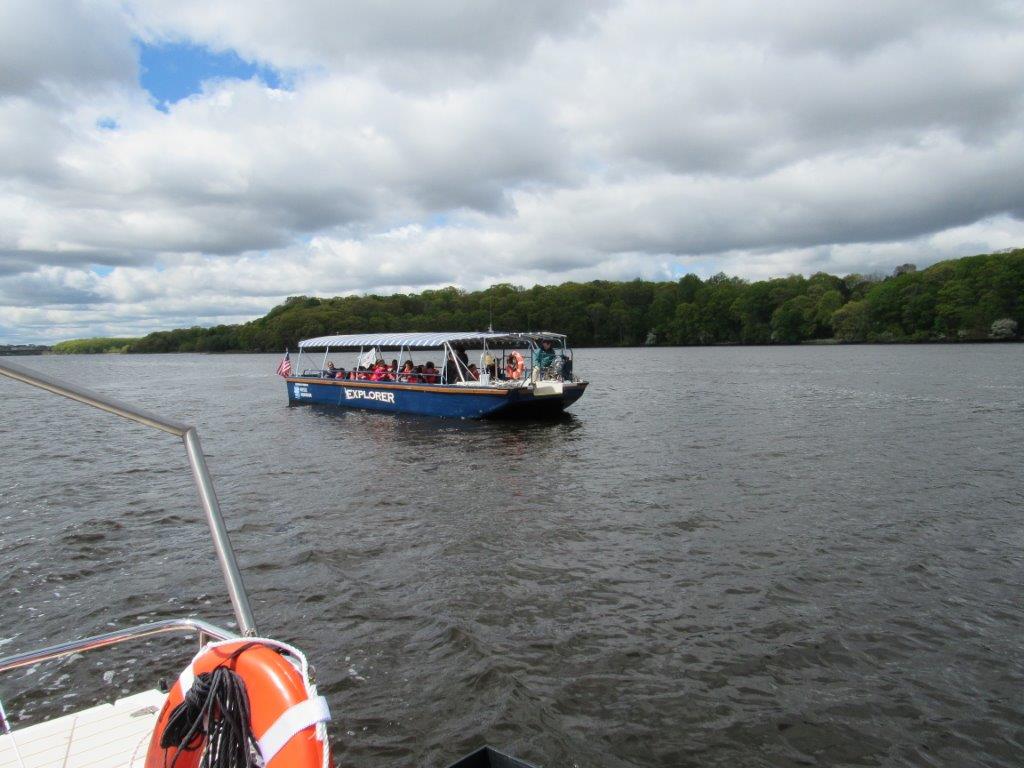
On Wednesday, May 15th the crew of the R/V Monitor was out on the upper Bay collecting bacteria samples, taking Secchi Disk and Par sensor water clarity measurements, conducting water column profiles using the Seabird instrument, and conducting real-time surface mapping of water quality parameters, including dissolved oxygen, chlorophyll, water temperature, salinity and pH, all in an effort to document water quality improvements associated with NBC construction projects. Sara captained the boat while monitoring professionals Michael and Mike collected the samples and data. It was cloudy and chilly with wind out of the north all day. The waters were slightly choppy. The photo below features some young explorers out on the Seekonk River this day.
Bacteria Sampling
Twenty stations were sampled for fecal coliform bacteria in the Providence and Seekonk Rivers on May 1, 2019. Five stations were sampled for enterococci. In the five days prior to sampling, 2.13 inches of rainfall was recorded, contributing to slightly elevated bacteria levels.
The fecal coliform geometric mean for all sites was 66 MPN/100 mL. Higher fecal coliform results occurred in the Seekonk River (geometric mean: 71 MPN/100 mL) compared to the Providence River (geometric mean: 64 MPN/100 mL). The maximum fecal coliform concentration (230 MPN/100 mL) was measured in the Providence River at three sites -- Point Street Bridge, Collier Point Park, and Edgewood Yacht Club. Geometric mean results indicate both rivers exceeded state primary contact and shellfishing standards.
The enterococci geometric mean for the Seekonk and Providence Rivers decreased from the previous sampling, from 27 MPN/100 mL to 23 MPN/100 mL. Enterococci concentrations ranged from 10 MPN/100 mL at the South FP East location to 97 MPN/100 mL at Point Street Bridge. These results are within the state criteria for primary contact.
Please note: the results of NBC's fecal coliform and enterococci monitoring are for informational/research purposes only and are not intended to suggest official state compliance with bathing or shellfishing standards.
