Historical News
R/V Monitor's Blog
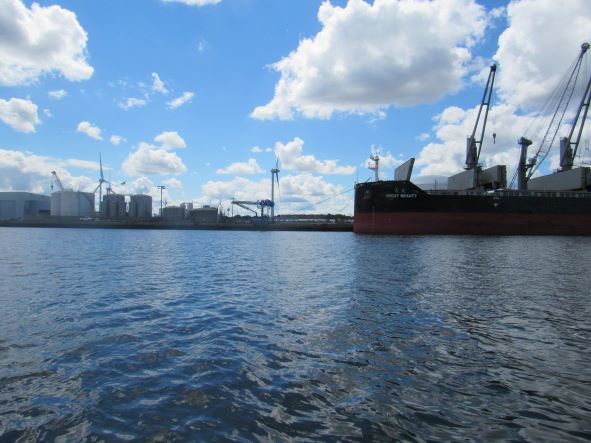
On Wednesday, November 30th, the crew of the R/V Monitor was out on the upper Bay collecting nutrients samples, taking Secchi Disk water clarity measurements, conducting water column profiles using a profiling sonde, and conducting real-time surface mapping of water quality parameters, including dissolved oxygen, chlorophyll, water temperature, salinity, and pH, all in an effort to document water quality improvements associated with NBC construction projects. Jeffrey captained the boat while monitoring professionals Fern, Gerard and Steve collected the samples and data. It was a sunny and brisk day with no wind and calm waters. The featured photo from our archives shows ProvPort from the east.
Water Column Clarity
Water clarity was measured at seven locations in the Providence River and Seekonk River estuaries on November 23. Conditions leading up to the survey were dry, with no precipitation recorded at TF Green in the five days prior. Secchi depth averaged 3.1 meters, compared to 3.2 meters on the previous survey (November 17). The lowest clarity this week (2.2 meters) was measured at Pomham Rocks, while the greatest clarity (4.7 meters) was measured at Conimicut Point. There was a general north-to-south gradient of increasing water clarity among the sites this week.
Bacteria Sampling
On November 23, twenty stations were sampled for fecal coliform bacteria in the Providence and Seekonk Rivers. Five of these stations were also sampled for enterococci bacteria. No precipitation was recorded at TF Green in the five days prior to sampling.
| | Fecal Coliform | Enterococci |
| Primary Contact1 | Geometric mean ≤50 MPN/100 mL | Geometric mean ≤35 colonies/100 mL |
| Shellfishing | Geometric mean ≤14 MPN/100 mL | NO ENTEROCOCCI CRITERIA |
Surface Mapping
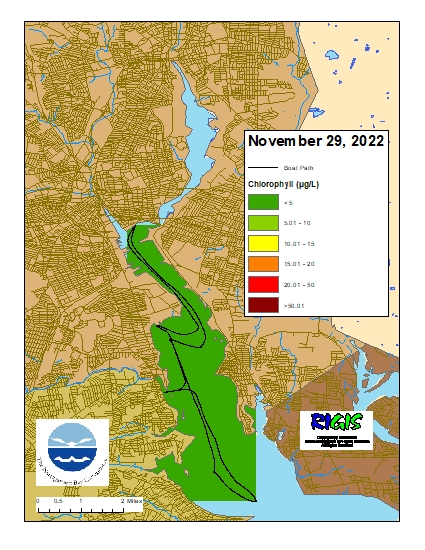
Data were collected on November 29, 2022, while the R/V Monitor was underway collecting nutrient samples in the Providence River estuary. The average chlorophyll concentrations were good in the areas surveyed. From north to south, average chlorophyll concentrations were as follows: Upper Providence River (0.46 µg/L), Edgewood Shoals area (0.46 µg/L), Pawtuxet River area (0.49 µg/L), and Lower Providence River (0.80 µg/L). Overall, chlorophyll ranged between 0.12 and 1.21 µg/L with an overall average of 0.57 µg/L. The chlorophyll data from this date are presented in the map below:
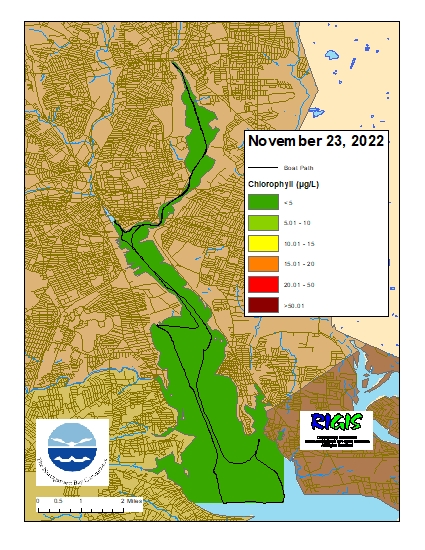
Surface Mapping
Data were collected on November 23, 2022, while the R/V Monitor was underway collecting bacteria samples in the Providence and Seekonk River estuaries. The average chlorophyll concentrations were good in the areas surveyed. From north to south, average chlorophyll concentrations were as follows: Seekonk River (0.51 µg/L), Upper Providence River (0.58 µg/L), Edgewood Shoals area (1.04 µg/L), Pawtuxet River area (0.51 µg/L), and Lower Providence River (0.41 µg/L). Overall, chlorophyll ranged between 0.05 and 1.64 µg/L with an overall average of 0.55 µg/L. The chlorophyll data from this date are presented in the map below: