Historical News
Bacteria Sampling
Twenty stations were sampled for fecal coliform bacteria in the Providence and Seekonk Rivers on April 19, 2017. Five of these stations were also sampled for Enterococci bacteria. Sampling occurred after five days of relatively dry weather, with only 0.05 inches recorded over the course of a few scattered showers. Bacteria counts in both rivers were generally low this week, and were within state primary contact standards; the results from the Providence River were also within shellfishing standards. The geometric mean fecal coliform count in the Seekonk River was 15 MPN/100 mL and in the Providence River was 8 MPN/100 mL. The maximum fecal coliform concentration was 93 MPN/100 mL, measured at the Point St. Bridge location. The overall fecal coliform geometric mean for both rivers was 10 MPN/100 mL.
Enterococci results were similarly low. The geometric mean for all sites was 11 MPN/100 mL, while the maximum result was 20 MPN/100 mL, also measured at Point St. Bridge.
Please note: the results of NBC's fecal coliform and Enterococci monitoring are for informational/research purposes only and are not intended to suggest official state compliance with bathing or shellfishing standards.
Bacteria Sampling
Twenty stations were sampled for fecal coliform bacteria in the Providence and Seekonk Rivers on April 5, 2017. Five of these stations were also sampled for Enterococci bacteria. Sampling occurred after five days of heavy rain, totaling 3.44 inches; the day before sampling included 1.51 inches of rainfall. These heavy rains led to elevated bacteria counts in both rivers. The geometric mean fecal coliform count in the Seekonk River was 191 MPN/100 mL and in the Providence River was 415 MPN/100 mL. The maximum fecal coliform concentration was 1,500 MPN/100 mL, measured at the Off FP Outfall location in the Providence River. The overall fecal coliform geometric mean for both rivers was 324 MPN/100 mL.
Enterococci results were also elevated following the heavy rains. The geometric mean of Enterococci concentrations was 88 MPN/100 mL, while the maximum result was 160 MPN/100 mL, measured at Phillipsdale Landing.
The elevated results in both rivers exceeded primary contact and shellfishing standards.
Please note: the results of NBC's fecal coliform and Enterococci monitoring are for informational/research purposes only and are not intended to suggest official state compliance with bathing or shellfishing standards.
R/V Monitor's Blog
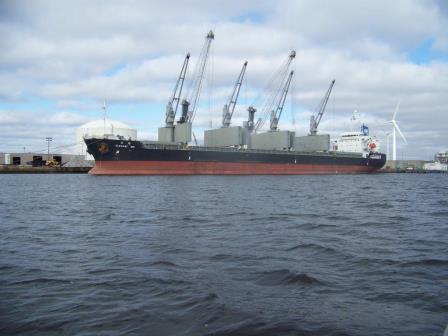
On Wednesday, April 19th, the crew of the R/V Monitor was out on the upper Bay collecting bacteria samples, taking Secchi Disk and Par sensor water clarity measurements, conducting water column profiles using the Seabird instrument, and conducting real-time surface mapping of water quality parameters, including dissolved oxygen, chlorophyll, water temperature, salinity, and pH, all in an effort to document water quality improvements associated with NBC construction projects. Jeffrey captained the boat while monitoring professionals Fern and Michael collected the samples and data. It was a partly sunny and brisk day with light winds. The below photo of a cargo ship was taken at the Port of Providence this day.

Water Column Profiles
Six water column profiles were collected throughout the Providence River estuary on Wednesday, March 29th. Moderately heavy rainfall of 0.7 inches was recorded at T.F. Green Airport over the two days prior to the survey, and the two sites nearest to river inputs exhibited relatively low surface salinities. At Pawtuxet Cove, the top 1-m surface salinity measured 14.0 psu, while bottom salinity measured 24.2 psu; at India Point Park, surface salinity measured 15.5 psu, versus bottom salinities around 29.0 psu. The rest of the sites surveyed exhibited a more well-mixed water column. Temperatures among all sites were consistent, ranging 3.9-5.1°C, slightly cooler than the previous survey on March 1st. Dissolved oxygen (DO) was high at all sites; the minimum, 9.8 mg/L, was observed in the bottom waters at India Point Park. The highest DO was measured in the relatively fresh surface waters at 1 m at Pawtuxet Cove, at 11.4 mg/L. Fluorescence was variable and slightly lower than the previous survey; the lowest fluorescence was 2.4 ug/L, measured near the surface at India Point Park, while the highest, 25.9 ug/L, was measured at the bottom (10.25 m) at Conimicut Point.
Water Column Profiles
Six water column profiles were collected throughout the Providence and Seekonk River estuaries on Wednesday, March 1st. Light rainfall of 0.13 inches was recorded in the Providence area four days prior to the survey, with additional trace rain falling over the next three days. Rainfall on the survey date may have impacted sites surveyed in the afternoon (Edgewood Yacht Club, Pomham Rocks, and India Point Park). Low salinities were observed at Phillipsdale Landing, the site closest to the major river input of the Blackstone. The top 1-m surface salinity at this site ranged 7.5–11.3 psu, while bottom salinities of ~17.3 psu were also relatively low. Minor density stratification was observed at India Point Park, Pomham Rocks, and Edgewood Yacht Club, where surface salinities ranged ~13.0-21.0 psu and bottom salinities ranged 27.0-29.0 psu; temperatures were ~7°C at the surface versus ~5°C at the bottom. These surface temperatures represented a slight warming since the previous survey on February 1st. Dissolved oxygen (DO) was high at all sites; the minimum, 9.2 mg/L, was observed mid-water column at India Point Park. The highest DO was measured at the surface of Bullock Reach, at 12.7 mg/L. Fluorescence was variable, though generally higher than the previous survey; the lowest fluorescence was 0.3 ug/L, measured near the surface at Pawtuxet Cove, while the highest, 47.9 ug/L, was measured at the bottom (14 m) at Bullock Reach.


