Historical News
R/V Monitor's Blog
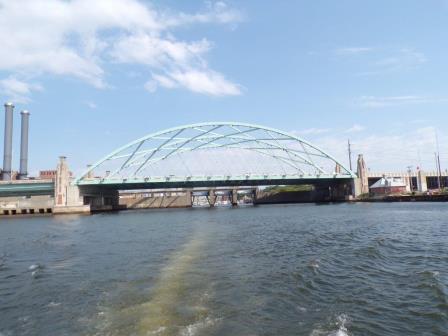
On Wednesday, July 11th, the crew of the R/V Monitor was out on the upper Bay collecting bacteria samples, taking Secchi Disk and Par sensor water clarity measurements, conducting water column profiles using the Seabird instrument, and conducting real-time surface mapping of water quality parameters, including dissolved oxygen, chlorophyll, water temperature, salinity and pH, all in an effort to document water quality improvements associated with NBC construction projects. Jeff captained the boat while monitoring professionals Sara and Heather collected the samples and data. Summer intern Nick assisted with the sample and data collection as well. It was a sunny and warm day with a light breeze and calm waters. The photo taken this day shows the Interstate 195 Iway bridge and Providence hurricane barrier as viewed from the south.
Water Column Profiles
Water column profiles were measured at eight sites in the Providence and Seekonk Rivers on June 13, 2018. There was minimal rainfall in the five days prior to sampling. Most sites exhibited a well-mixed water column, except for Phillipsdale where some stratification was observed.
Salinity in surface waters ranged from 7.0 psu at Phillipsdale to 27.1 psu at Conimicut Point. Salinity at depth ranged from 22.4 psu at Phillipsdale to 29.4 psu at Conimicut Point. Surface temperatures ranged from 17.9°C at Conimicut Point, to 20.2°C at Point Street Bridge. Temperatures at depth ranged from 15.5°C at India Point Park and Conimicut Point, to 18.8°C at Pawtuxet Cove.
Oxygen levels were variable this week, though remained above the hypoxia threshold of 2.9 mg/L. The minimum DO concentration was observed near the bottom waters of India Point Park, at 3.8 mg/L; most other sites had water column DO in the 5-8 mg/L range. Lastly, the maximum fluorescence, 8.3 mg/m3, was observed at about 3.25 m depth at Pomham Rocks.
Water Column Clarity
Water clarity was measured at seven locations in the Providence and Seekonk Rivers on July 11, 2018. There was 0.03 inches of rain in the five days prior to sampling. Overall, average clarity decreased from the previous week by 0.4 m, to 1.3 m. There were no increases observed at any station. Secchi depth ranged from 1.23 m at Phillipsdale Landing, Pomham Rocks, and Edgewood Yacht Club to 1.50 m at Bullock Reach. There was no evidence of a north to south water clarity gradient.
Surface Mapping
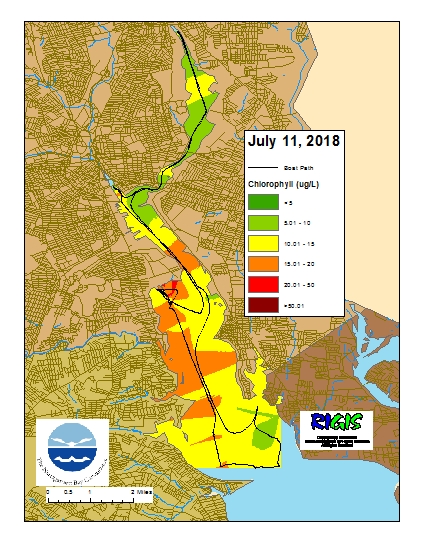
Data was collected on July 11, 2018 while the R/V Monitor was underway collecting bacteria samples and performing vertical profiles in the Providence and Seekonk River estuaries. The chlorophyll concentrations were fair in areas surveyed. From north to south, average chlorophyll concentrations were as follows: Seekonk River (9.09 µg/l), Upper Providence River (10.72 µg/l), Edgewood Shoals area (15.71 µg/l), Pawtuxet River area (16.07 µg/l), and the Lower Providence River (13.78 µg/l). Overall, chlorophyll ranged between 3.70 µg/l and 26.80 µg/l with an overall average of 12.13 µg/l. The chlorophyll data from this date is presented in the map below:
Nutrients Sampling

