Historical News
Surface Mapping
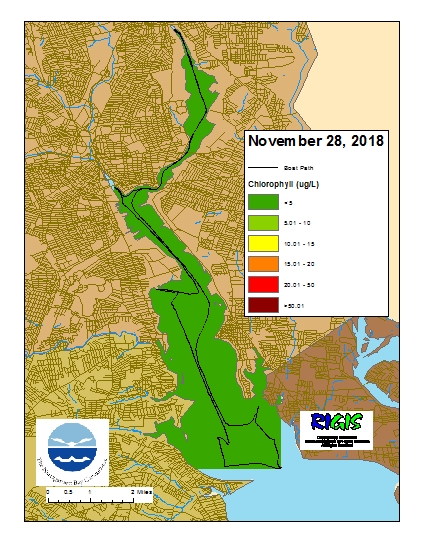
Data was collected on November 28, 2018 while the R/V Monitor was underway collecting bacteria samples and performing vertical profiles in the Providence and Seekonk River estuaries. The chlorophyll concentrations were low in areas surveyed. From north to south, average chlorophyll concentrations were as follows: Seekonk River (1.98 µg/l), Upper Providence River (1.76 µg/l), Edgewood Shoals area (1.29 µg/l), Pawtuxet River area (1.34 µg/l), and the Lower Providence River (1.11 µg/l). Overall, chlorophyll ranged between non-detectable and 2.80 µg/l with an overall average of 1.61 µg/l. The chlorophyll data from this date is presented in the map below:
Water Column Profiles
Highest surface water salinity measurements occurred at Conimicut Point and Bullock Reach, where salinity was approximately 23 psu. Lowest surface salinity (5.8 psu) was observed at India Point Park. Bottom salinity ranged from 10.4 psu at Pawtuxet Cove to 30.9 psu at Conimicut Point. The coldest surface water temperature was observed at India Point Park, at 6.5°C, while the greatest surface water temperature (9.5°C) occurred at Bullock Reach. Bottom water temperatures ranged from 7.9°C at Pawtuxet Cove to 12.4°C at India Point Park.
Hypoxic conditions (dissolved oxygen <2.9 mg/L) were not present at any of the sites sampled. Dissolved oxygen ranged from 5.19 mg/L at Bullock Reach to 11.9 mg/L at India Point Park. Fluorescence was low (<3 mg/m3) at all sites, and the maximum fluorescence (2.2 mg/m3) was observed at Conimicut Point.
R/V Monitor's Blog
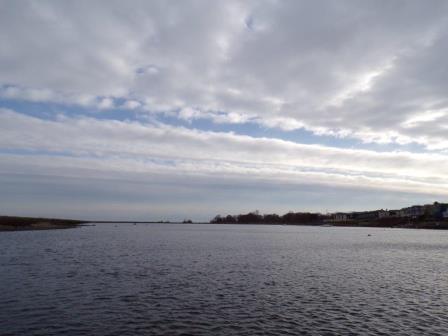
On Wednesday, November 21st, the crew of the R/V Monitor was out on the upper Bay collecting nutrients and plankton samples, taking Secchi Disk and Par sensor water clarity measurements, conducting water column profiles using the Seabird instrument, and conducting real-time surface mapping of water quality parameters, including dissolved oxygen, chlorophyll, water temperature, salinity, and pH, all in an effort to document water quality improvements associated with NBC construction projects. Sara captained the boat while monitoring professionals Mike, Steve and Fern collected the samples and data. It was a cold day, cloudy in the morning, with sun shining through by the afternoon. There was moderate wind from the southwest, and a slight chop on the water throughout the day. The photo below shows a spectacular view of the sky this day.
Water Column Clarity
Water clarity was measured at six locations in the Providence and Seekonk Rivers on November 21, 2018. Light rainfall (0.2 inches) occurred on the day prior to sampling. Five days before sampling, there was 0.94 inches of recorded precipitation. Average water clarity increased from the previous week, from 1.1 m to 1.6 m.
Water clarity increased at India Point Park, Pomham Rocks, Pawtuxet Cove, Bullock Reach, and Conimicut Point. Largest increases in clarity (≥ 1 m) occurred at Conimicut Point and Bullock Reach. Secchi depth ranged from 0.90 m at Edgewood Yacht Club to 2.50 m at Conimicut Point and Bullock Reach. There was evidence of a slight north to south water clarity gradient.
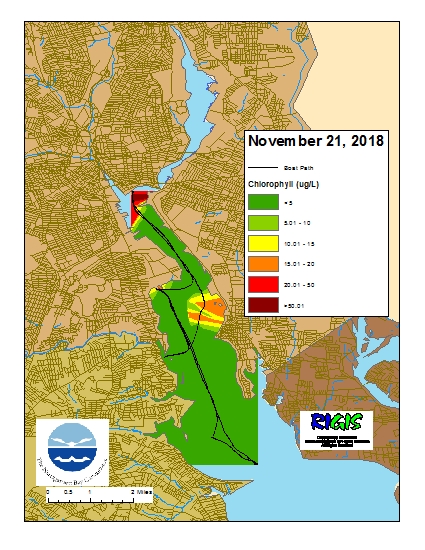
Surface Mapping
Data was collected on November 21, 2018 while the R/V Monitor was underway collecting nutrient samples and performing vertical profiles in the Providence River estuary. The chlorophyll concentrations were mostly low in areas surveyed. From north to south, average chlorophyll concentrations were as follows: Upper Providence River (16.00 µg/l), Edgewood Shoals area (1.63 µg/l), Pawtuxet River area (1.54 µg/l), and the Lower Providence River (1.06 µg/l). Overall, chlorophyll ranged between non-detectable and 69.90 µg/l with an overall average of 6.08 µg/l. The chlorophyll data from this date is presented in the map below: