Historical News
Fixed Site Network
Phillipsdale
At Phillipsdale, sonde data revealed fair to poor water quality conditions over the course of the week. There was about 0.51 inches of rainfall recorded for the week, with all of it falling on August 5th. Surface and bottom salinities declined throughout the week. Surface salinity began the week mainly around 15 psu, but decreased to an average of about 5 psu at weeks end, the overall average was 10.1 psu and ranged from 1.8 psu – 18.8 psu. Bottom salinity was affected by tidal fluctuations, though also exhibited an overall decrease throughout the week and had an average salinity of 21.0 psu and a range of 7.0 psu – 27.5 psu. Both surface and bottom temperatures increased from last week with surface temperatures averaging 23.8oC and a range of 19.0oC – 27.0oC; bottom temperatures had an average of 22.8oC and ranged between 20.3oC – 25.6oC. Surface chlorophyll increased throughout the week, peaking to about 27.0 ug/L on the 3rd , but was overall relatively low with a weekly average of 3.4 ug/L. Dissolved oxygen (DO) for the week was fair at the surface and was nearly hypoxic the entire week at the bottom. The surface did not have any readings below 2.9 mg/L and increased over the course of the week; the average surface DO was 7.7 mg/L and ranged from 3.2 mg/l to 14.1 mg/L. Dissolved oxygen in the bottom waters had a weekly average of 2.5 mg/l and ranged from a minimum of 0.5 mg/L to a maximum of 9.5 mg/L. Rolling and daily averages of bottom DO showed nearly constant hypoxic conditions this week, except for on the 3rd and 4th when daily average DO was above 3.4 mg/L. Note that tidal fluctuations and Blackstone River flow greatly influence bottom DO, temperature and salinity at this location.
Bullocks Reach
Water quality at Bullocks Reach was good this week. There was a generally uniform water column from surface to bottom with little to no stratification evident. Temperatures increased at each of the three depths with the surface water temperature averaging 23.2oC, mid water temperatures had an average of 22.5oC and bottom water temperatures averaged of 20.4oC Surface, mid and bottom salinities were relatively steady over the course of the week and averaged 26.5 psu, 27.7 psu, and 29.4 psu, respectively. Surface and bottom dissolved oxygen (DO) had a slight decline over the course of the week, whereas DO at the mid depth increased slightly. There was hardly any incidence of hypoxia at any of the depths, except for a few values around 2.9 mg/L on the 4th. Surface DO had a minimum of 4.8 mg/L, a maximum of 13.4 mg/L, and an average of 7.8 mg/L for the week. At the mid depth DO data showed good conditions with an average of 6.9 mg/L, a minimum of 4.2 mg/L and a maximum of 10.2 mg/L. The average weekly bottom DO was 4.3 mg/L and ranged between 2.8 mg/L to 6.4 mg/L. Surface chlorophyll peaked on the 31st at about 20 ug/L and then continued to decline over the course of the week, with a weekly average of 8.0 ug/L; mid chlorophyll peaked on the 1st at about 14 ug/L, with a weekly average of 7.5 ug/L.
Fixed Site Network
Phillipsdale
At Phillipsdale, sonde data revealed fair to poor water quality conditions over the course of the week. There was about 0.57 inches of rainfall recorded for the week, with most of it falling at the beginning of the week. Freshwater flow from the Blackstone River increased around the 25th in response to this rainfall; surface and bottom salinities declined throughout the week in response to this increased flow. Some stratification was evident between surface and bottom at the beginning of the week. Surface salinity began the week mainly around 17 psu, but decreased to an average of about 14 psu at weeks end, the overall average was 14.7 psu and ranged from 4.8 psu – 22.7 psu. Bottom salinity was affected by tidal fluctuations, though also exhibited an overall decrease throughout the week and had an average salinity of 22.0 psu and a range of 14.8 psu – 27.0 psu. Both surface and bottom temperatures decreased from last week with surface temperature averaging 22.3oC and a range of 20.3oC – 25.3oC; bottom temperatures had an average of 21.9oC and ranged between 20.8oC – 24.8oC. Surface chlorophyll decreased throughout the week, but was overall relatively low with an average of 2.4 ug/L. Dissolved oxygen (DO) for the week was fair at the surface and was nearly hypoxic the entire week at the bottom. The surface had some readings of DO below 2.9 mg/L, but overall had an average of 4.7 mg/L and ranged from 2.1 mg/l to 8.9 mg/L. Dissolved oxygen in the bottom waters had a weekly average of 2.3 mg/l and ranged from a minimum of 1.1 mg/L to a maximum of 5.8 mg/L. Rolling and daily averages of bottom DO showed nearly constant hypoxic conditions this week, except for some early morning/late evening increases in DO. Note that tidal fluctuations greatly influence bottom DO, temperature and salinity at this location.
Bullocks Reach
Water quality at Bullocks Reach was good this week. Surface water temperatures decreased this week by about 2.5oC, with an average of 21.8oC; bottom water temperatures increased slightly this week, with an overall averaged of 20.6oC. Mid depth temperatures actually increased throughout the week and were warmer than the surface by the end of the week by about 2oC and had a weekly average of 21.2oC. Surface, mid and bottom salinities were relatively steady over the course of the week and averaged 25.6 psu, 27.8 psu, and 28.9 psu, respectively. Dissolved oxygen (DO) at all three depths increased throughout the week, but some hypoxia was evident at some point during the week at all three depths. Surface DO had a minimum of 2.6 mg/L, a maximum of 9.2 mg/L, and an average of 5.1 mg/L for the week. At the mid depth DO data showed relatively good conditions with an average of 4.5 mg/L, a minimum of 2.2 mg/L and a maximum of 7.7 mg/L. Bottom DO began the week mostly below the hypoxic threshold of 2.9 mg/L, but increased steadily throughout the week; the average weekly bottom DO was 4.0 mg/L and ranged between 2.3 mg/L to 5.7 mg/L. Surface chlorophyll indicated two small blooms one at the beginning of the week and one at the end, peaking at around 23 ug/L with a weekly average of 7.7 ug/L.
R/V Monitor's Blog
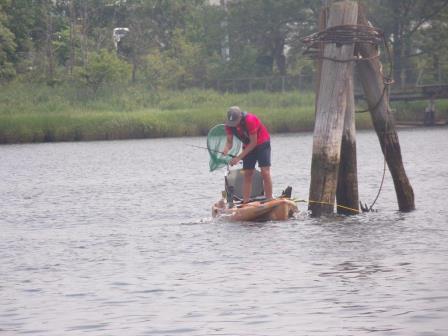
On Wednesday, August 2nd, the crew of the R/V Monitor was out on the upper Bay collecting nutrients and plankton samples, taking Secchi Disk and Par sensor water clarity measurements, conducting water column profiles using the Seabird instrument, and conducting real-time surface mapping of water quality parameters, including dissolved oxygen, chlorophyll, water temperature, salinity, and pH, all in an effort to document water quality improvements associated with NBC construction projects. Sara captained the boat while monitoring professionals Fern and Michael collected the samples and data. It was a muggy day with cloudy skies turning partly cloudy by the afternoon. The water was calm in the morning, and became a bit choppy by the afternoon as the wind picked-up. The below photo of a kayaker fishing was taken by the Narragansett Boating Center.
Surface Mapping
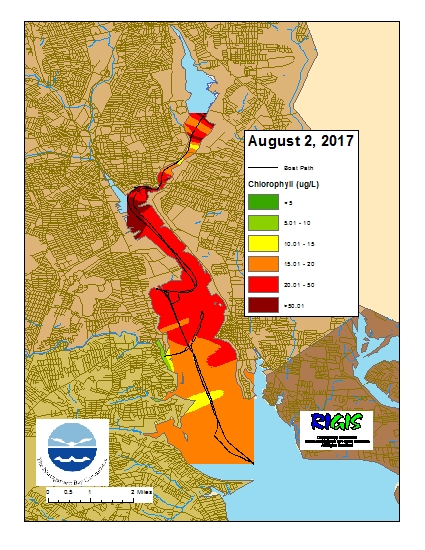
Data was collected on August 2, 2017 while the R/V Monitor was underway collecting nutrient samples and performing vertical profiles in the Providence and Seekonk River estuaries. The chlorophyll concentrations in areas surveyed ranged from fair to poor with evidence of a north-south gradient in the Providence River. From north to south, average chlorophyll concentrations were as follows: Seekonk River (45.25 µg/l), Upper Providence River (46.41 µg/l), Edgewood Shoals area (28.58 µg/l), Pawtuxet River area (13.83 µg/l), and the Lower Providence River (18.18 µg/l). Overall, chlorophyll ranged between 5.5 and 144.0 µg/l with an overall average of 30.43 µg/l. The chlorophyll data from this date is presented in the map below:
Nutrients Sampling
Seven bay stations and seven river stations were sampled for nutrients on June 21, 2017. Seven of the bay stations were sampled both at surface and at depth. A total of 0.13 inches of rain fell during the three days prior to sampling.
Among the river stations, the lowest nitrogen concentrations were observed on the Moshassuck River at Higginson Avenue, where concentrations of 656 ppb total nitrogen (TN), 513 ppb total dissolved nitrogen (TDN), and 280 ppb dissolved inorganic nitrogen (DIN) were measured. The highest TN and TDN were measured on the Ten Mile River at the outlet of Omega Pond (1030 ppb and 890 ppb, respectively), and the highest DIN was measured on the Blackstone River at Slater Dam (556 ppb).
Among the surface bay stations, TN ranged from 870 ppb at Conimicut Point to 1370 ppb at Phillipsdale Landing, following a north to south gradient. TDN was also highest at Phillipsdale Landing (878 ppb), and lowest at Bullock Reach (227 ppb). DIN ranged from 17.6 ppb at Conimicut Point to 479 ppb at India Point Park. Chlorophyll a ranged from 2.3 µg/L at Phillipsdale to a very high maximum of 54.0 µg/L at Pomham Rocks. The southernmost stations including Conimicut Point, Edgewood Yacht Club, and Bullock Reach were observed to have similarly high (above 25 µg/L) chlorophyll concentrations. These concentrations indicate that a large phytoplankton bloom was likely sampled. Overall, chlorophyll a averaged 29.0 µg/L, a very large increase from the previous week.
Results from nutrient sampling completed on July 6th and July 19th are pending analysis from the NBC Laboratory. The next anticipated nutrients sampling data is August 2nd.

