Week of October 22 - 28, 2017
Nutrients Sampling
Fourteen river stations and three bay stations were sampled for surface nutrients on October 25, 2017. Bay stations were limited due to rough and unsafe conditions on the water. Heavy rain over 1.5 inches fell over the day before and day of sampling.
Among the river stations, the highest nitrogen values were observed on the Taunton River at Berkley Bridge. There, the total nitrogen (TN) concentration was 2640 ppb, total dissolved nitrogen (TDN) was 2520 ppb, and dissolved inorganic nitrogen (DIN) was 2172 ppb. The lowest TN (589 ppb) was observed on the Moshassuck River at Mill St., the lowest TDN (274 ppb) was observed on the Palmer River at Rt. 6, and the lowest DIN (42.73 ppb) was observed at the Warren Reservoir/Kickemuit River.
Among the bay stations, the lowest TN result (652 ppb) and TDN result (365 ppb) were observed at Bullock Reach Buoy, while the lowest DIN result (192.5 ppb) was observed at Conimicut Point. Maximum nitrogen values were observed at Phillipsdale Landing, the northernmost site in the Seekonk River, where concentrations of 1240 ppb TN, 1010 ppb TDN, and 714 ppb DIN were measured. Chlorophyll a concentrations ranged from 3.6 µg/L at Bullock Reach Buoy to 4.3 µg/L at Conimicut Point, and averaged 3.8 µg/L overall, a slight increase compared to the previous sampling date (though far fewer sites were sampled this week).
Results from nutrient sampling completed on November 8th and December 6th are pending analysis from the NBC Laboratory. The next anticipated nutrients sampling date is December 20th, 2017.
Week of October 8 - 14, 2017
Nutrients Sampling
Seven bay stations and seven river stations were sampled for nutrients on October 11, 2017. Bay stations were sampled at both surface and bottom depths. Approximately 0.41 inches of rainfall was recorded at TF Green in the three days prior to the sample date.
Among the river stations, the highest nitrogen values were observed on the Blackstone River at Slater Mill. There, the total nitrogen (TN) concentration was 1300 ppb, total dissolved nitrogen (TDN) was 1240 ppb, and dissolved inorganic nitrogen (DIN) was 944.4 ppb. The lowest TN (528 ppb) and TDN (546 ppb) were observed on the Moshassuck River at Higginson Ave., while the lowest DIN (266 ppb) was observed on the Ten Mile River at Omega Pond.
Among the bay stations, the lowest TN result of 972 ppb was observed at India Point Park, the lowest TDN result of 472 ppb was measured at Conimicut Point, and the lowest DIN result of 300 ppb was observed at Bullock Reach Buoy. Maximum nitrogen values were observed at Pawtuxet Cove, where the Pawtuxet River enters the Bay, where concentrations of 1400 ppb TN, 945 ppb TDN, and 701 ppb DIN were measured. Chlorophyll a concentrations ranged from 1.3 µg/L at Pomham Rocks to 3.7 µg/L at Phillipsdale Landing, and averaged 2.2 µg/L overall, a decrease compared to the previous sampling date.
Results from nutrient sampling completed on October 25th, November 8th, and December 6th are pending analysis from the NBC Laboratory. The next anticipated nutrients sampling date is December 20th, 2017.
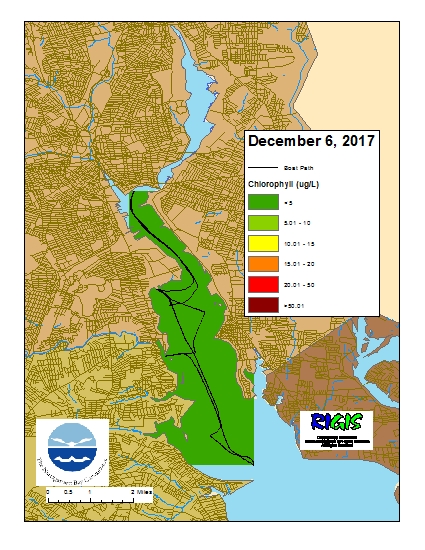
Week of December 3 - 9, 2017
Surface Mapping
Data was collected on December 6, 2017 while the R/V Monitor was underway collecting nutrient samples and performing vertical profiles in the Providence River estuary. The chlorophyll concentrations were low in areas surveyed. From north to south, average chlorophyll concentrations were as follows: Upper Providence River (1.47 µg/l), Edgewood Shoals area (1.53 µg/l), Pawtuxet River area (1.59 µg/l), and the Lower Providence River (1.37 µg/l). Overall, chlorophyll ranged between non-detectable and 4.6 µg/l with an overall average of 1.48 µg/l. The chlorophyll data from this date is presented in the map below:
Week of November 26 - December 2, 2017
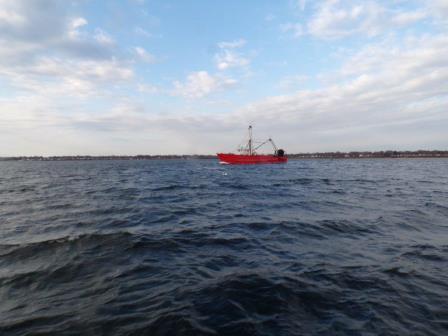
R/V Monitor's Blog
The R/V Monitor was out on the upper Bay twice this week. First, on Tuesday, November 28th, the crew was out conducting benthic video transects at Edgewood Yacht Club and also to the east of the J&W Marina. It was partly sunny and cool all day with minimal wind and waves in the morning, but the wind picked up in the afternoon making the waters a bit choppy. Jeff and Sara switched off captaining the boat, while monitoring professional Mike assisted with the transect activities. On Wednesday, November 29th, the crew of the R/V Monitor was out on the upper Bay collecting bacteria samples, taking Secchi Disk and Par sensor water clarity measurements, conducting water column profiles using the Seabird instrument, and conducting real-time surface mapping of water quality parameters, including dissolved oxygen, chlorophyll, water temperature, salinity, and pH, all in an effort to document water quality improvements associated with NBC construction projects. Sara captained the boat while monitoring professionals Mike and Heather collected the samples and data. It was a partly sunny and breezy day, making the waters a bit choppy. The photo below shows a passing fishing vessel this day.
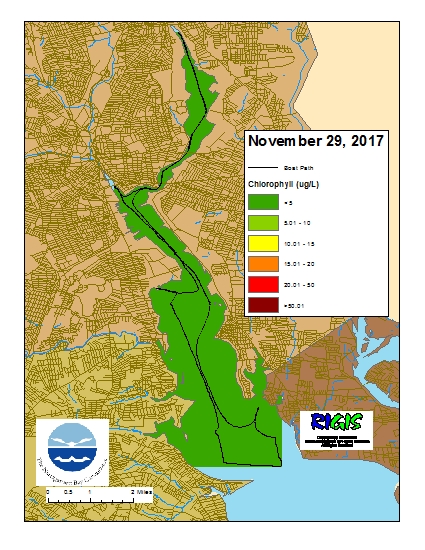
Week of November 26 - December 2, 2017
Surface Mapping
Data was collected on November 29, 2017 while the R/V Monitor was underway collecting bacteria samples and performing vertical profiles in the Providence and Seekonk River estuaries. The chlorophyll concentrations were low in areas surveyed. From north to south, average chlorophyll concentrations were as follows: Seekonk River (1.73 µg/l), Upper Providence River (1.31 µg/l), Edgewood Shoals area (1.88 µg/l), Pawtuxet River area (1.90 µg/l), and the Lower Providence River (1.33 µg/l). Overall, chlorophyll ranged between non-detectable and 5.9 µg/l with an overall average of 1.55 µg/l. The chlorophyll data from this date is presented in the map below: