Historical News
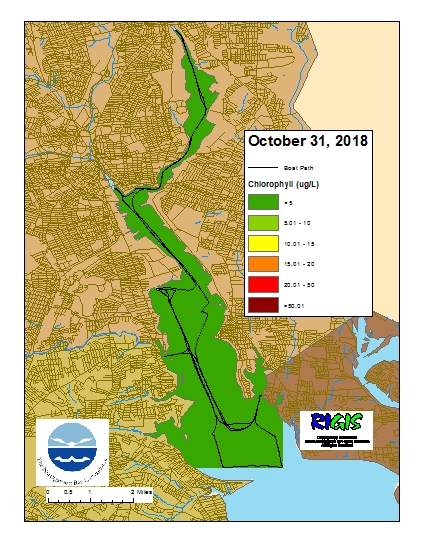
Surface Mapping
Data was collected on October 31, 2018 while the R/V Monitor was underway collecting bacteria samples and performing vertical profiles in the Providence and Seekonk River estuaries. The chlorophyll concentrations were low in areas surveyed. From north to south, average chlorophyll concentrations were as follows: Seekonk River (2.47 µg/l), Upper Providence River (1.68 µg/l), Edgewood Shoals area (1.49 µg/l), Pawtuxet River area (2.04 µg/l), and the Lower Providence River (1.61 µg/l). Overall, chlorophyll ranged between non-detectable and 5.20 µg/l with an overall average of 1.85 µg/l. The chlorophyll data from this date is presented in the map below:
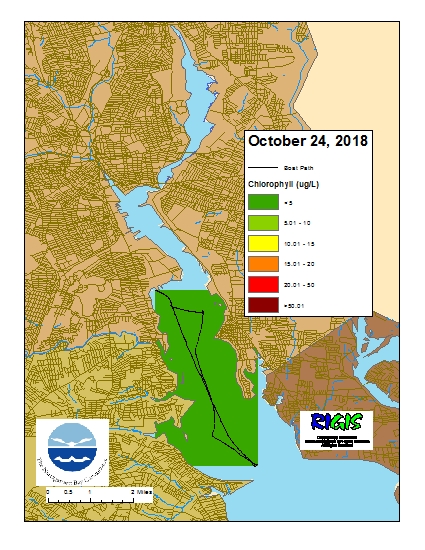
Surface Mapping
Data was collected on October 24, 2018 while the R/V Monitor was underway collecting nutrient samples and performing vertical profiles in the Providence River estuary. The chlorophyll concentrations were low in areas surveyed. From north to south, average chlorophyll concentrations were as follows: Edgewood Shoals area (3.07 µg/l), Pawtuxet River area (2.73 µg/l), and the Lower Providence River (2.36 µg/l). Overall, chlorophyll ranged between 0.20 µg/l and 7.40 µg/l with an overall average of 2.59 µg/l. The chlorophyll data from this date is presented in the map below:
Surface Mapping
Data was collected on October 17, 2018 while the R/V Monitor was underway collecting bacteria samples and performing vertical profiles in the Providence and Seekonk River estuaries. The chlorophyll concentrations were low in areas surveyed. From north to south, average chlorophyll concentrations were as follows: Seekonk River (3.78 µg/l), Upper Providence River (3.21 µg/l), Edgewood Shoals area (3.04 µg/l), Pawtuxet River area (2.98 µg/l), and the Lower Providence River (3.13 µg/l). Overall, chlorophyll ranged between 0.90 µg/l and 8.20 µg/l with an overall average of 3.29 µg/l.
The chlorophyll data from this date is presented in the map below: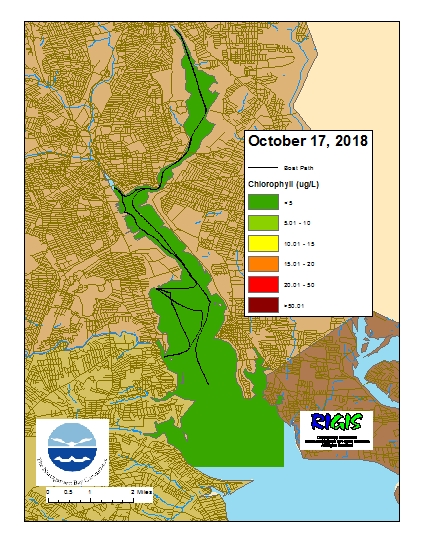
*Due to file error the lowest portion of the boat path for this survey is not displayed.
Nutrients Sampling
On September 26, 2018, nutrient sampling was conducted at eight local river stations and seven bay stations. Both surface and bottom waters were sampled at all bay stations. Approximately 3.5 inches of precipitation occurred prior to sampling; heavy rainfall started the day before sampling and continued into the early morning hours the day of sample collection.
The highest riverine nitrogen concentrations were observed in the Ten Mile River at Roger Williams Avenue. At this site, total nitrogen (TN) was 1,065 ppb, total dissolved nitrogen (TDN) was 977 ppb, and dissolved inorganic nitrogen (DIN) was 587 ppb. The Moshassuck River at Higginson Avenue had the lowest TN, TDN, and DIN concentrations, at 539 ppb, 408 ppb, and 127 ppb, respectively.
Among surface samples from the bay sites, the highest TN, TDN, and DIN results occurred at Phillipsdale Landing, with values of 1,130 ppb, 1,060 ppb, and 797 ppb, respectively. The lowest measured TN value (602 ppb) occurred at Bullock Reach. Conimicut Point had the lowest TDN and DIN values, where TDN was 400 ppb and DIN was 236 ppb. The overall chlorophyll a average was 2.47 ug/L; chlorophyll a was highest at Pawtuxet Cove (4.93 ug/L) and lowest at Phillipsdale landing (0.93 ug/L).
Results from nutrient sampling completed on October 11 and October 24 are pending final analysis from the NBC Laboratory. The next anticipated nutrient sampling date is November 7, 2018.
Nutrients Sampling
Among the river stations sampled, the highest total nitrogen (TN), total dissolved nitrogen (TDN), and dissolved inorganic nitrogen (DIN) values were observed in the Taunton River at Berkley Bridge, with concentrations of 1,920 ppb, 1,680 ppb, and 1,317 ppb, respectively. The Ten Mile River at Roger Williams Avenue had the lowest TN and TDN concentrations, at 501 and 450 ppb, respectively. The lowest DIN concentration (87 ppb) was observed at the Warren Reservoir/Kickemuit River location.
Among surface samples from the bay sites, the highest TN and TDN results occurred at Phillipsdale Landing, with values of 1,230 and 929 ppb, respectively. The lowest measured TN and TDN values were observed at the Bullock Reach Buoy site, where TN was 734 ppb and TDN was 397 ppb. Dissolved inorganic nitrogen concentrations ranged from 217 ppb at Conimicut Point to 672 ppb at Pawtuxet Cove. The overall chlorophyll a average was 10.2 ug/L; chlorophyll a was highest at Pomham Rocks (22.9 ug/L) and lowest near Pawtuxet Cove (5.5 ug/L).
Results from nutrient sampling completed on September 26, October 11, and October 24 are pending final analysis from the NBC Laboratory. The next anticipated nutrient sampling date is November 7, 2018.

