Historical News
Surface Mapping
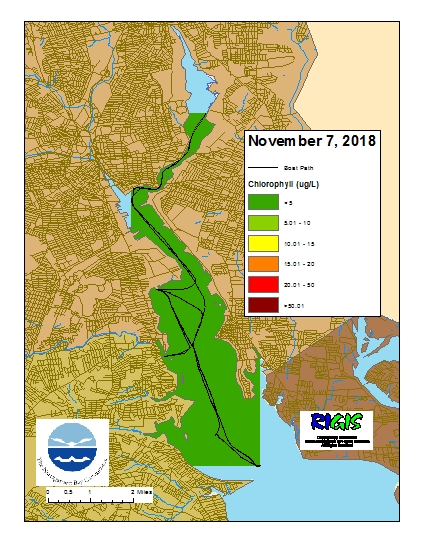
Data was collected on November 7, 2018 while the R/V Monitor was underway collecting nutrient samples and performing vertical profiles in the Providence and Seekonk River estuaries. The chlorophyll concentrations were low in areas surveyed. From north to south, average chlorophyll concentrations were as follows: Seekonk River (3.37 µg/l), Upper Providence River (2.56 µg/l), Edgewood Shoals area (2.02 µg/l), Pawtuxet River area (2.69 µg/l), and the Lower Providence River (1.62 µg/l). Overall, chlorophyll ranged between 0.40 µg/l and 4.80 µg/l with an overall average of 2.29 µg/l. The chlorophyll data from this date is presented in the map below:
Phytoplankton Sampling
Phytoplankton samples were collected at Bullock's Reach on October 24, 2018 and analyzed in the laboratory shortly after collection.
It was breezy and cloudy with an outgoing tide on Narragansett Bay. Sondes data revealed the surface water temperature was 13.29oC, salinity was 22.40 psu, and chlorophyll a was 2.3 ug/L.
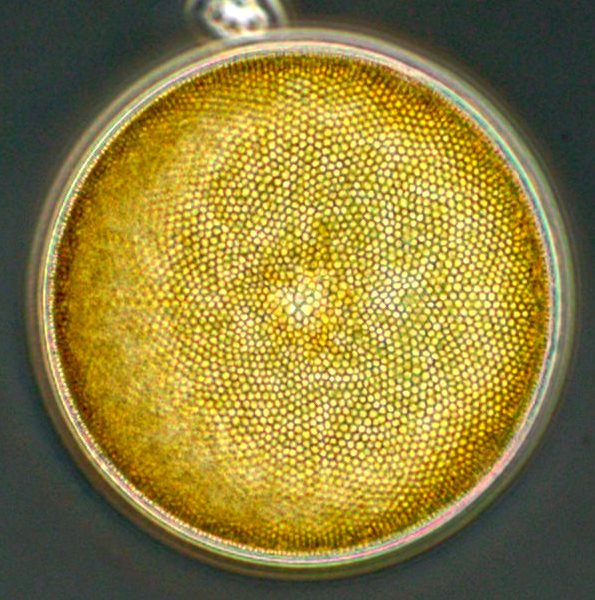
The plankton tow net sample was filterable with a 20 micron mesh. The filtrate was very clear with small distinct groups of algae. Many jellyfish were detected in the sample. The tow net sample was analyzed qualitatively for microorganisms using 100x phase contrast microscopy.
The whole water sample was analyzed quantitatively under 200x phase contrast microscopy. A Hensen Stempel pipette was used to accurately deliver 1ml of sample to a Sedge-wick Rafter chamber. This analysis revealed a total of 200,000 cells per Liter.
The most predominant phytoplankton was Skeletonema spp. at 104,000 cells/L. The flagellates were found at 26,000 cells/L and other representative genera include Leptocylindrus spp. and Akashiwo sanguineum sp.
Nutrients Sampling
Among the river stations sampled, highest total nitrogen (TN) and total dissolved nitrogen (TDN) values were measured in the Ten Mile River at Roger Williams Avenue, with reported values of 1280 ppb and 1290 ppb, respectively. The Moshassuck River at Higginson Avenue had the lowest TN (558 ppb) and TDN (499 ppb) values. DIN ranged from 326 ppb at the Moshassuck River at Higginson Avenue to 961 ppb at the Pawtuxet River at Broad Street location.
Among surface waters of the bay sites, TN ranged from 930 at Phillipsdale Landing to 1030 ppb at Edgewood Shoals. Phillipsdale Landing had the highest TDN and DIN values, with results of 870 ppb and 640 ppb, respectively. The lowest TDN concentrations (approximately 650 ppb) were observed at both Edgewood Shoals and Pomham Rocks. Pomham Rocks also exhibited the lowest DIN value, at 488 ppb. Chlorophyll a averaged 4 ug/L, ranging from 2.3 ug/L at Edgewood Shoals to 5.6 ug/L at Phillipsdale Landing.
Results from nutrient sampling completed on October 24 are pending final analysis from the NBC Laboratory. The next anticipated date of sampling is November 7, 2018.
Water Column Clarity
Water clarity was measured at nine locations in the Providence and Seekonk Rivers on October 31, 2018. Approximately 2 inches of precipitation was recorded in the five days prior to sampling. However, no rainfall was recorded on the day prior to nor the day of sampling. Overall, average water clarity decreased from the previous week, from 2.7 m to 1.9 m. Decreases in water clarity were observed at Pomham Rocks and Edgewood Yacht Club, while water clarity increased at Bullock Reach and Conimicut Point. Secchi depth ranged from 1.03 m at Pawtuxet Cove to 3.23 m at Bullock Reach and Conimicut Point. There was slight evidence of a north to south water clarity gradient.
Bacteria Sampling
Twenty stations were sampled for fecal coliform bacteria in the Providence and Seekonk Rivers on October 31, 2018; five of these stations were also sampled for enterococci bacteria. In the five days prior to sampling, nearly 2 inches of rainfall was recorded, with the majority of precipitation (1.81 in) occurring four days prior to sampling.
Fecal coliform geometric mean increased from the previous sampling to 120 MPN/100 mL. Fecal coliform concentrations were higher in the Providence River (geometric mean: 130 MPN/100 mL) than in the Seekonk River (geometric mean: 101 MPN/100 mL). The highest Seekonk River fecal coliform value, 230 MPN/100 mL, was measured at Crook Point. In the Providence River, the maximum fecal coliform concentration of 430 MPN/100 mL was measured at both the Save the Bay and South F.P. East locations. Geometric mean results indicate both rivers exceeded primary contact and shellfishing standards.
The overall enterococci geometric mean was 107 MPN/100 mL. Concentrations ranged from approximately 88 MPN/100 mL at Conimicut Point (geometric mean of two duplicates) to 156 MPN/100 mL at South F.P. East. Bridge. The geometric mean of all results exceeded the state primary contact standard.
Please note: the results of NBC's fecal coliform and enterococci monitoring are for informational/research purposes only and are not intended to suggest official state compliance with bathing or shellfishing standards.

