Historical News
Nutrients Sampling
Seven bay stations and seven river stations were sampled for nutrients on November 21, 2018. Surface and bottom waters were sampled at all bay stations. In the day prior to sampling, 0.2 inches of rainfall occurred. Five days before sampling, there was 0.94 in of recorded rainfall.
Among the river stations sampled, highest total nitrogen (TN), total dissolved nitrogen (TDN), and dissolved inorganic nitrogen (DIN) values were measured in the Ten Mile River at Roger Williams Avenue, with reported values of 1210 ppb, 1320 ppb, and 1033 ppb, respectively. The Woonasquatucket River at Manton Avenue had the lowest measured TN (580 ppb), TDN (620 ppb), and DIN (400 ppb) values.
Out of the bay surface water samples, the highest TN concentration was observed at Phillipsdale Landing, at 878 ppb. The highest bay surface TDN and DIN concentrations occurred at Pawtuxet Cove, at 869 ppb and 644 ppb, respectively. Lowest TN and TDN values were observed at Conimicut Point, at 500 ppb TN and 536 ppb TDN. The lowest bay DIN value (334 ppb) occurred at Bullock Reach Buoy. Chlorophyll a averaged 1.0 ug/L, ranging from 0.4 ug/L at Edgewood Yacht Club to 1.9 ug/L at Phillipsdale Landing.
Results from nutrient sampling completed on December 5 and December 19 are pending final analysis from the NBC Laboratory. The next anticipated date of sampling is January 2, 2019.
R/V Monitor's Blog
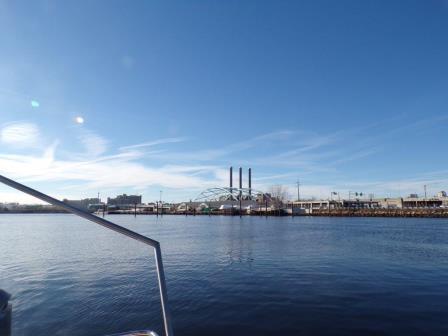
On Wednesday, December 19th, the crew of the R/V Monitor was out on the upper Bay collecting nutrients samples, taking Secchi Disk and Par sensor water clarity measurements, conducting water column profiles using the Seabird instrument, and conducting real-time surface mapping of water quality parameters, including dissolved oxygen, chlorophyll, water temperature, salinity, and pH, all in an effort to document water quality improvements associated with NBC construction projects. Sara captained the boat while monitoring professionals Bekki and Mike collected the samples and data. It was a cold but sunny day, with no wind and calm waters. The photo below features the I-195 Iway bridge as seen from the south.
Surface Mapping
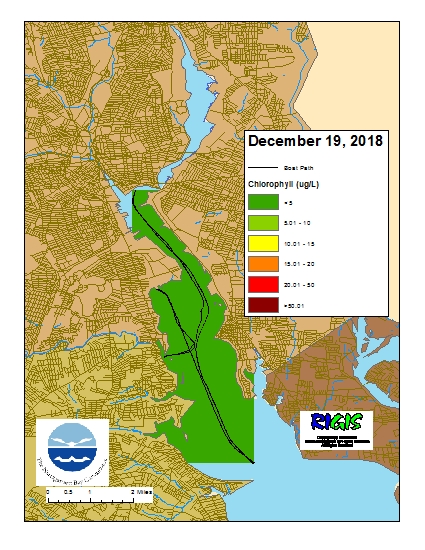
Data was collected on December 19, 2018 while the R/V Monitor was underway collecting nutrient samples and performing vertical profiles in the Providence River estuary. The chlorophyll concentrations were low in areas surveyed. From north to south, average chlorophyll concentrations were as follows: Upper Providence River (1.78 µg/l), Edgewood Shoals area (2.42 µg/l), Pawtuxet River area (2.20 µg/l), and the Lower Providence River (1.60 µg/l). Overall, chlorophyll ranged between 0.60 µg/l and 4.30 µg/l with an overall average of 2.03 µg/l. The chlorophyll data from this date is presented in the map below:
Nutrients Sampling
Among the river stations sampled, highest total nitrogen (TN), total dissolved nitrogen (TDN), and dissolved inorganic nitrogen (DIN) values were measured in the Ten Mile River at Central Avenue, with reported values of 1250 ppb, 1180 ppb, and 853 ppb, respectively. The Woonasquatucket River at Valley Street had the lowest measured TN (503 ppb) and TDN (589 ppb) values. Lowest DIN concentrations were observed in the Palmer River at Route 6, at 82 ppb.
Highest bay surface nutrient concentrations occurred at Pawtuxet Cove, with TN, TDN, and DIN concentrations of 928 ppb, 896 ppb, and 624 ppb, respectively. Edgewood Shoals demonstrated the lowest nitrogen values, at 547 ppb TN, 508 ppb TDN, and 362 ppb DIN. Chlorophyll a averaged 0.6 ug/L, ranging from <0.3 ug/L at Conimicut Point to 1.3 ug/L at Phillipsdale Landing.
Results from nutrient sampling completed on November 21 and December 5 are pending final analysis from the NBC Laboratory. The next anticipated date of sampling is December 19, 2018.
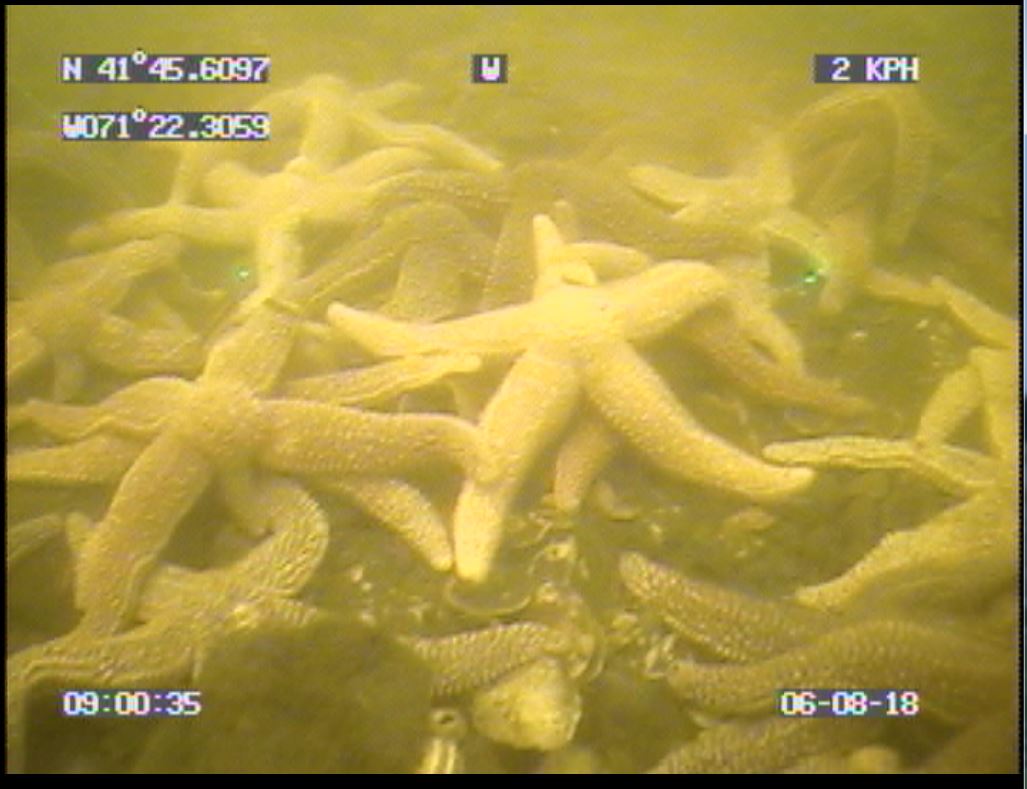
Benthic Video Blog