Historical News
Surface Mapping
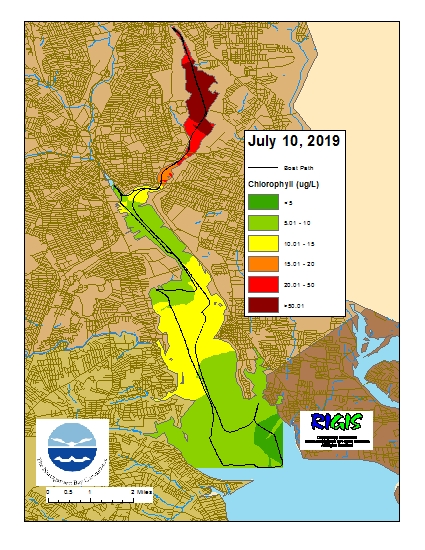
Data was collected on July 10, 2019 while the R/V Monitor was underway collecting bacteria samples and performing vertical profiles in the Providence and Seekonk River estuaries. The chlorophyll concentrations were overall fair with a slight north-south gradient, with the exception of the Seekonk River. From north to south, average chlorophyll concentrations were as follows: Seekonk River (59.82 µg/l), Upper Providence River (9.77 µg/l), Edgewood Shoals area (9.65 µg/l), Pawtuxet River area (10.74 µg/l), and the Lower Providence River (6.82 µg/l). Overall, chlorophyll ranged between 2.90 µg/l and 375.70 µg/l with an overall average of 26.28 µg/l. The chlorophyll data from this date is presented in the map below:
Water Column Clarity
Water clarity was measured at six locations in the Providence River on July 3, 2019. In the five days prior to sampling, 0.79 inches of precipitation was recorded, the majority of which occurred 3 days prior to sampling. Average water clarity increased slightly from the previous week, from 1.7 m to 1.8 m, driven by increases in water clarity in the lower portion of Upper Narragansett Bay.
Water clarity increased at Pomham Rocks, Bullock Reach, and Conimicut Point. Water clarity decreased at India Point Park, Edgewood Yacht Club, and Pawtuxet Cove. The largest increase in clarity, 0.83 m, occurred at Bullock Reach. Secchi depth ranged from 1.17 m at Pawtuxet Cove to 2.53 m at Bullock Reach. A north to south water clarity gradient was observed.
Surface Mapping
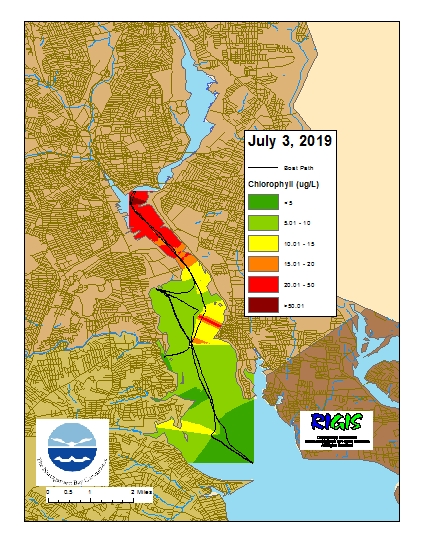
Data was collected on July 3, 2019 while the R/V Monitor was underway collecting nutrient samples and performing vertical profiles in the Providence River estuary. The chlorophyll concentrations were overall fair with the exception of the Upper Providence River. From north to south, average chlorophyll concentrations were as follows: Upper Providence River (24.64 µg/l), Edgewood Shoals area (7.57 µg/l), Pawtuxet River area (5.76 µg/l), and the Lower Providence River (7.24 µg/l). Overall, chlorophyll ranged between 1.60 µg/l and 233.90 µg/l with an overall average of 11.09 µg/l. The chlorophyll data from this date is presented in the map below:
Fixed Site Network
Phillipsdale Landing
Water quality was fair this week at Phillipsdale Landing. Sondes were switched out for routine maintenance on June 25th. Salinity ranged from 2.1 psu to 16.8 psu at the surface, averaging approximately 7.4 psu. At the bottom, salinity fluctuated with tides, ranging from 7.8 psu to 28.4 psu and averaging 22.1 psu. Surface and bottom temperatures continued to increase this week. Surface temperatures ranged from 18.7oC to 28.0oC and averaged 22.8oC. Bottom temperatures averaged 19.6oC, ranging from 16.9oC to 24.4oC. Dissolved oxygen (DO) in surface waters ranged from 5.5 mg/L to 18.9 mg/L, averaging 11.0 mg/L. Hypoxic conditions (DO < 2.9 mg/L) in bottom waters were observed intermittently throughout the week; minimum recorded DO was 1.4 mg/L. Bottom water DO averaged 3.9 mg/L. Surface and bottom waters exhibited an increasing trend in chlorophyll concentrations throughout the week; concentrations increased from <2.5 to >70 ug/L, averaging 37.8 ug/L at the surface and 29.8 ug/L at the bottom for the week. Note that tidal fluctuations and Blackstone River flow greatly influence bottom DO, temperature, and salinity at this location.
Bullock Reach
The data showed good water quality at all three depths at Bullock Reach. Water column mixing occurred following a rain event on June 25th, followed by some stratification towards the end of the week. In general, salinity decreased and temperature increased at all three depths over the course of the week. Surface salinity averaged 24.5 psu, ranging from 21.4 to 26.6 psu. Salinity at the mid sonde averaged 26.9 psu and ranged from 23.4 to 29.5 psu. Average salinity was greatest (30.4 psu) at the bottom sonde, ranging from 27.9 to 31.6 psu. The greatest difference in salinities with depth occurred around June 29th, when salinity ranged from approximately 21.4 psu at the surface to 30.9 psu at the bottom. Current temperature averages for this deployment period were 21.5oC at the surface, 20.1oC at the mid sonde, and 17.2oC at the bottom. The greatest difference in temperature with depth occurred around June 28th, when surface temperatures were 24.6oC and bottom temperatures were 16.7oC.
There were no recorded measurements of hypoxia (<2.9 mg/L dissolved oxygen [DO]) at any of the three depths. Surface DO averaged 9.1 mg/L with a minimum of 6.3 mg/L; the mid depth had an average of 7.4 mg/L, and a minimum of 5.2 mg/L. The bottom sonde had an average DO of 4.9 mg/L and a minimum of 3.4 mg/L. Bottom DO peaked on June 26th, with a reading of 7.5 mg/L, and declined towards the end of the week, but did not decrease below the hypoxia threshold. Surface chlorophyll averaged 14.9 ug/L over the deployment period, with a minimum value of 2.5 ug/L and a peak of 24.9 ug/L occurring on June 24th. Chlorophyll at the mid sonde averaged 11.1 ug/L and ranged from 1.8 ug/L to 18.5 ug/L. Chlorophyll at the bottom sonde peaked during water column mixing on June 26th, at 22.4 ug/L. Chlorophyll at the bottom depth averaged 5.3 ug/L and had a minimum recorded value of 1.4 ug/L.
Fixed Site Network
Phillipsdale
Water quality was fair this week at Phillipsdale Landing. Salinity ranged from 2 psu to 20 psu at the surface, averaging approximately 8 psu. At the bottom, salinity fluctuated with tides, ranging from 5 psu to 28 psu and averaging 19 psu. Surface temperatures increased this week, ranging from 18.5oC to 21.9oC and averaging 20.1oC. Bottom temperatures averaged 18.8oC, ranging from 16.6oC to 20.4oC. Dissolved oxygen (DO) in surface waters ranged from 4.1 mg/L to 13.1 mg/L, averaging 8.0 mg/L. Hypoxic conditions (DO < 2.9 mg/L) were observed towards the end of the week in bottom waters; minimum recorded DO was 1.9 mg/L. Bottom water DO averaged 4.5 mg/L. Surface waters exhibited a decreasing trend in chlorophyll concentrations throughout the week; concentrations decreased from 21 to 12 ug/L, averaging 16 ug/L for the week. A peak in chlorophyll concentration was observed on June 16th. Note that tidal fluctuations and Blackstone River flow greatly influence bottom DO, temperature, and salinity at this location.
Bullock Reach
The data showed good water quality at all three depths at Bullock’s Reach, with some stratification evident, particularly around June 21st. Surface salinities continued to decrease during this week, while salinity at the mid sonde remained relatively stable and salinity recorded at the bottom sonde exhibited a slight increase. The greatest difference in salinities with depth occurred around June 21st, when salinity ranged from approximately 18 psu at the surface to 29 psu at the bottom. Over the week, surface salinity averaged 22.8 psu, the mid depth salinity averaged 26.8 psu, and bottom salinity averaged 29.9 psu. Current temperature averages for this deployment period were 19.7oC at the surface,18.6oC at the mid sonde, and 16.9oC at the bottom. There were no recorded measurements of hypoxia (<2.9 mg/L dissolved oxygen [DO]) at any of the three depths. Surface DO averaged 8.6 mg/L with a minimum of 6.3 mg/L; the mid depth had an average of 6.5 mg/L, and a minimum of 4.8 mg/L. The bottom sonde had an average DO of 5.6 mg/L and a minimum of 4.2 mg/L. With these new sondes, chlorophyll measurements are able to be taken at all three depths. Surface chlorophyll averaged 19.8 ug/L over the deployment period, with a minimum value of 5.2 ug/L and a peak of 45.5 ug/L occurring on June 21st. Chlorophyll at the mid sonde decreased over the deployment period; it averaged 10.2 ug/L and ranged from 0.04 ug/L to 34.2 ug/L at this location. Chlorophyll at the bottom sonde also decreased over the deployment period, with a maximum value of 24.8 ug/L, a minimum value of 0.4 ug/L, and an average of 4.8 ug/L.

