Historical News
Bacteria Sampling
Summary of Rhode Island Bacteria Standards for Saltwater Primary Contact and Shellfishing
| | Fecal Coliform | Enterococci |
| Primary Contact1 | Geometric mean ≤50 MPN/100 mL | Geometric mean ≤35 colonies/100 mL |
| Shellfishing | Geometric mean ≤14 MPN/100 mL | NO ENTEROCOCCI CRITERIA |
Water Column Clarity
Water clarity was measured at six locations in the Providence River estuary on June 15, 2022. Conditions leading up to the survey were wet, with 1.34 inches of precipitation recorded in the three days prior. Secchi depth averaged 1.4 meters, compared to 1.8 meters on the previous survey (June 7). The lowest clarity this week (0.9 meters) was measured at Pawtuxet Cove, while the greatest clarity (2.0 meters) was measured at Bullock Reach. There was no clear north-to-south gradient in water clarity among the sites this week.
R/V Monitor's Blog
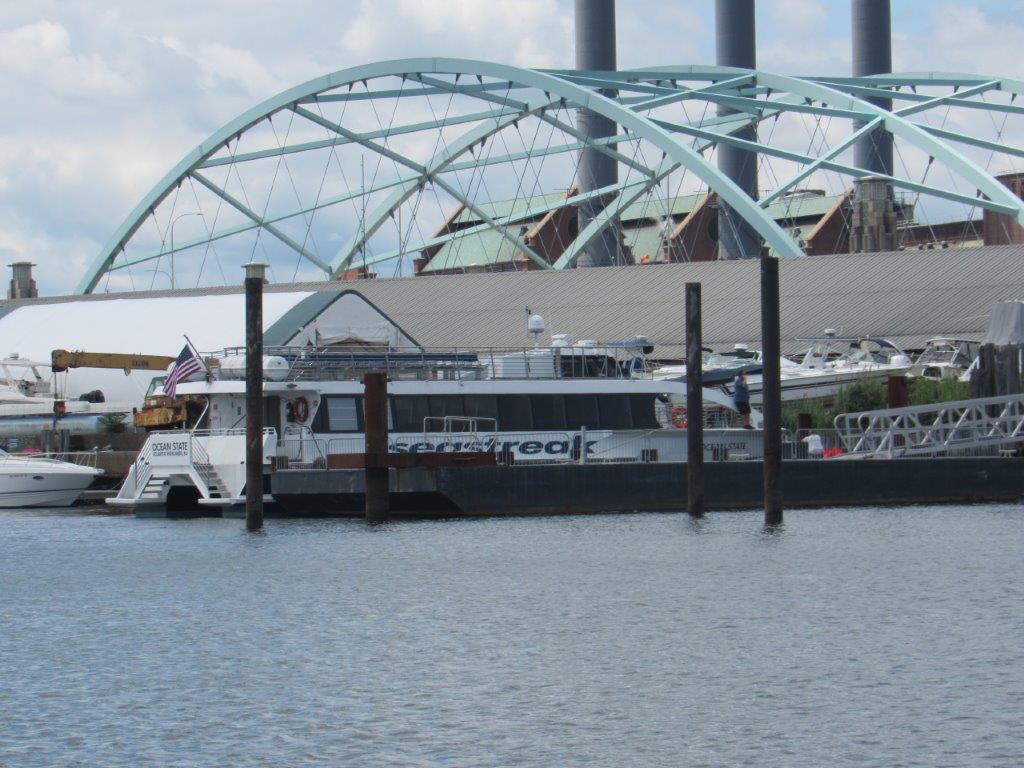
On Wednesday, June 15th, the crew of the R/V Monitor was out on the upper Bay collecting nutrients and plankton samples, taking Secchi Disk water clarity measurements, conducting water column profiles using the Seabird instrument, and conducting real-time surface mapping of water quality parameters, including dissolved oxygen, chlorophyll, water temperature, salinity, and pH, all in an effort to document water quality improvements associated with NBC construction projects. Sara captained the boat while monitoring professionals Fern, Justin and Tyler collected the samples and data. It was a warm and sunny day with a breeze from the northwest. There was a slight chop on the water this day. The featured photo is of the Providence-Newport ferry with the I-195 Iway bridge in the background.
Surface Mapping
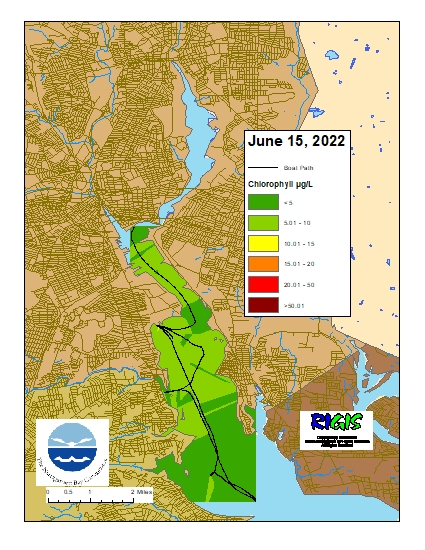
Data were collected on June 15, 2022, while the R/V Monitor was underway collecting nutrient samples in the Providence River estuary. The average chlorophyll concentrations were good to fair in the areas surveyed. From north to south, average chlorophyll concentrations were as follows: Upper Providence River (6.63 µg/L), Edgewood Shoals area (7.67 µg/L), Pawtuxet River area (5.81 µg/L), and Lower Providence River (4.11 µg/L). Overall, chlorophyll ranged between 1.90 and 17.02 µg/L with an overall average of 5.62 µg/L. The chlorophyll data from this date are presented in the map below:
Fixed Site Network
Phillipsdale Landing
Sondes were swapped for routine maintenance on the morning of June 1. Overall, water quality at Phillipsdale Landing was good this week. Weather conditions were moderately dry, with 0.55 inches of rainfall recorded at T.F. Green on Friday. Blackstone River flows declined over the course of the week and remained below historical 16-year median flow rates. Surface salinity averaged 15.2 ppt and ranged from 5.3 ppt to 23.0 ppt, while bottom salinity averaged 23.8 ppt and ranged from 14.5 ppt to 28.6 ppt. Temperatures continue to warm, averaging 20.6°C at the surface and 18.4°C on the bottom. Surface temperatures ranged from 18.6°C to 23.9°C, while bottom temperatures ranged from 16.7°C to 22.3°C.
Dissolved oxygen (DO) concentrations decreased this week but remained mostly above the hypoxia threshold (2.9 mg/L). Surface DO averaged 9.4 mg/L with a minimum of 5.0 mg/L, while bottom DO averaged 5.3 mg/L, with a minimum of 2.8 mg/L. Chlorophyll readings decreased from the previous week, averaging 28.2 µg/L on the surface and 14.7 µg/L on the bottom. Maximum surface chlorophyll readings reached 64.8 µg/L. Please note that tidal fluctuations and Blackstone River flows greatly influence water column salinity, temperature, and DO at this location.
Bullock Reach
Water quality at Bullock Reach was good for this first full week of the season. Surface salinity ranged from 22.8 ppt to 28.6 ppt and averaged 25.5 ppt. Salinity at mid-depth ranged from 25.3 ppt to 31.1 ppt and averaged 29.0 ppt. Bottom salinity ranged from 30.1 ppt to 32.6 ppt and averaged 31.7 ppt. Water column temperatures averaged 19.8°C, 18.5°C, and 16.3°C at the surface, mid, and bottom, respectively. Surface temperatures ranged from 18.5°C to 22.5°C, mid temperatures ranged from 16.7°C to 21.6°C, and bottom temperatures ranged from 15.5°C to 17.9°C.
This week, DO averaged 9.1 mg/L at the surface, 6.8 mg/L at mid-depth, and 6.1 mg/L at the bottom. Waters at all depths remained above the hypoxia threshold, with minimum bottom DO measuring 4.8 mg/L. Chlorophyll concentrations were low, averaging 9.7 µg/L at the surface, 5.2 µg/L at mid-depth, and 4.5 µg/L at the bottom. The maximum chlorophyll this week was 21.3 µg/L measured in surface waters on June 4.

