Historical News
Phytoplankton Sampling
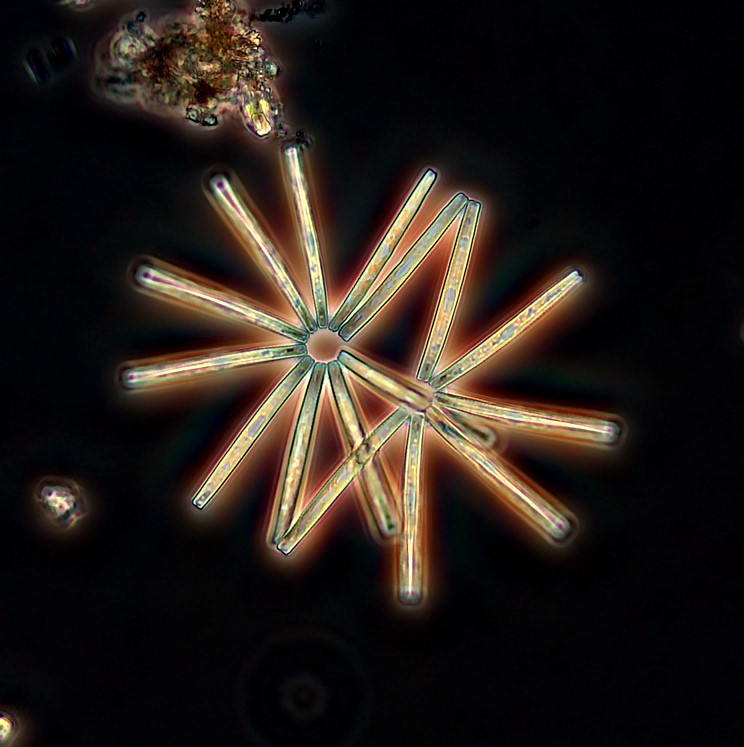
Phytoplankton samples were collected on February 12, 2020 at Bullock's Reach and analyzed in the laboratory shortly after collection. It was a sunny and brisk day with a north-northwest wind, about 8-12 knots, on Narragansett Bay. Sondes data revealed the surface water temperature was 4.56oC, salinity was 25.65 psu, and chlorophyll a was 1.7 ug/L. The plankton tow net sample was filterable with a 20 micron mesh. The filtrate was a tan color and had a short filter time. The tow net sample was analyzed qualitatively for microorganisms using 100x phase contrast microscopy. The whole water sample was analyzed quantitatively under 200x phase contrast microscopy. A Hensen Stempel pipette was used to accurately deliver 1ml of sample to a Sedge-wick Rafter chamber. This analysis revealed a total of 1,916,000 cells per Liter. The most predominant phytoplankton was Skeletonema spp.at 1608,000 cells/L. The flagellates were found at 24,000 cells/L. Representative genera include Leptocylindrus spp., Chaetoceros spp., and pennate diatoms.
200x phase contrast image of Thalassionema spp.
Fixed Site Network
Phillipsdale Landing
Water quality was good this week at Phillipsdale Landing. Approximately 0.41 inches of precipitation was recorded, with over half of this rainfall (0.25 in) occurring on March 3. Please note, three days before this reporting period, February 27, 0.85 inches of rainfall occurred. Sondes were changed out for routine maintenance during the morning of March 3, between 9:40 and 9:50 am EDT.
As reported in the previous post, following the rainfall on February 27, Blackstone River flows increased and surface salinity decreased in response to freshwater inputs. Surface salinity remained relatively low through the first part of the week, with a recorded minimum of approximately 1 ppt, but increased in the latter half of the week, reaching a maximum of 18.5 ppt. Overall, surface salinity averaged 5.9 ppt, slightly lower (fresher) than the previous week of data. Bottom salinity averaged 19.4 ppt and ranged from 1.8 ppt to 28.9 ppt; bottom salinity also increased over the course of the week. Compared to last week, both surface and bottom water temperatures increased. Surface water temperatures averaged 5.8°C and ranged from 2.2°C to 8.9°C, while bottom waters averaged 5.4°C and ranged from 3.4°C to 7.6°C.
Dissolved oxygen (DO) concentrations remained above the hypoxia threshold (>2.9 mg/L) at both depths. Surface DO averaged 12.4 mg/L, with a minimum of 11.3 mg/L and bottom DO averaged 11.5 mg/L, with a minimum of 10.3 mg/L. Surface chlorophyll-a was relatively low, averaging 4.3 ug/L, with a maximum of 10.6 ug/L recorded in the latter half of the week.
Bullock Reach
The Bullock Reach sondes were removed for the season on November 19.
Water Column Clarity
Water clarity was measured at seven locations in the Providence and Seekonk Rivers on March 4, 2020. Approximately 0.30 inches of rain fell over the three days prior to the survey, and water clarity decreased compared to the previous survey day. Overall, sites surveyed this week averaged 1.9 m Secchi depth, compared to 2.8 on February 12. The lowest clarity was measured at India Point Park (1.5 m), while the greatest clarity was measured at Conimicut Point and Bullock Reach (2.1 m). Overall, a gradient of increasing clarity among sites from north to south was observed.
Bacteria Sampling
Twenty stations were sampled for fecal coliform bacteria in the Providence and Seekonk Rivers on March 5, 2020. Five of these stations were also sampled for enterococci bacteria. Conditions leading up to the March 5 sampling day were mostly dry, with 0.30 inches of rainfall recorded over the five days prior.
The geometric mean of fecal coliform results for all sites was 21 MPN/100 mL, with Seekonk River sites having higher counts than Providence River sites (geometric means of 44 and 15 MPN/100 mL, respectively). The maximum count (93 MPN/100 mL) was measured at four different sites including Phillipsdale Landing, Crook Point, India Point Park, and Point Street Bridge. The enterococci results were below detection (<10 MPN/100 mL) across all sites. Both the Seekonk River and the Providence River had fecal coliform and enterococci results that were within state primary contact standards. Bacteria counts in both rivers exceeded state shellfishing standards.
Please note: the results of NBC's fecal coliform and enterococci monitoring are for informational/research purposes only and are not to intended to suggest official state compliance with bathing or shellfishing standards.
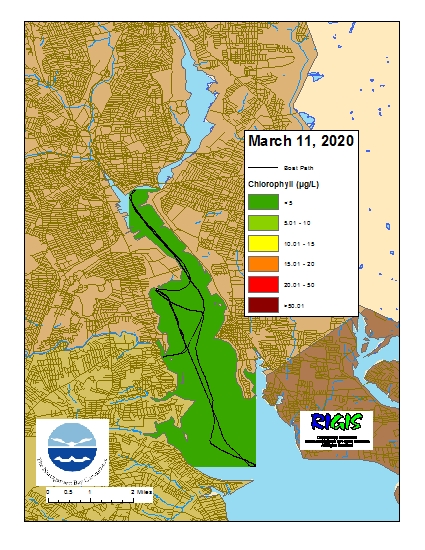
Surface Mapping
Data were collected on March 11, 2020 while the R/V Monitor was underway collecting nutrient samples in the Providence River estuary. The chlorophyll concentrations were good. From north to south, average chlorophyll concentrations were as follows: Upper Providence River (3.31 µg/L), Edgewood Shoals area (4.12 µg/L), Pawtuxet River area (3.26 µg/L), and Lower Providence River area (4.25 µg/L). Overall, chlorophyll ranged between non-detectable and 8.60 µg/L with an overall average of 3.77 µg/L. The chlorophyll data from this date are presented in the map below: